Architecture
This page is the conceptual architecture of StoatFlow — the model that runs your topology, the mechanisms behind the exactly-once and per-key-order guarantees, and what you can observe at runtime. It describes behaviour and design, not implementation: the source code is the source of truth for the specific algorithms, data structures, and internal protocols.
The single-instance model
The starting point is unusual for stream processing: a StoatFlow application runs as exactly one JVM process. There is no cluster, no scheduler, no worker pool. The process opens a Kafka consumer group with one member — itself — and that member is assigned every partition of every source topic the topology reads from.
Several properties follow directly from this:
- No rebalancing — there is no group to rebalance.
- Global state — every state store lives in this one process; any processing context can read or write any key.
- Deterministic behaviour — no inter-instance race, no clock skew between replicas, no split-brain between active instances.
- One coordinator — exactly-once commits are coordinated within the process, not across nodes.
What this model forbids is equally explicit. You cannot run two active replicas of the same StoatFlow application pointed at the same source topics. By default there is no second instance to coordinate with, and Kafka's consumer-group semantics would assign all partitions to one and idle the other. High availability comes from fast restart by default; an opt-in hot-standby tier adds one or more passive standbys for near-instant failover — still a single active instance, never two.
The design reasoning — including the trade-offs you accept by giving up open-ended horizontal scaling — is on Motivation.
Data flow
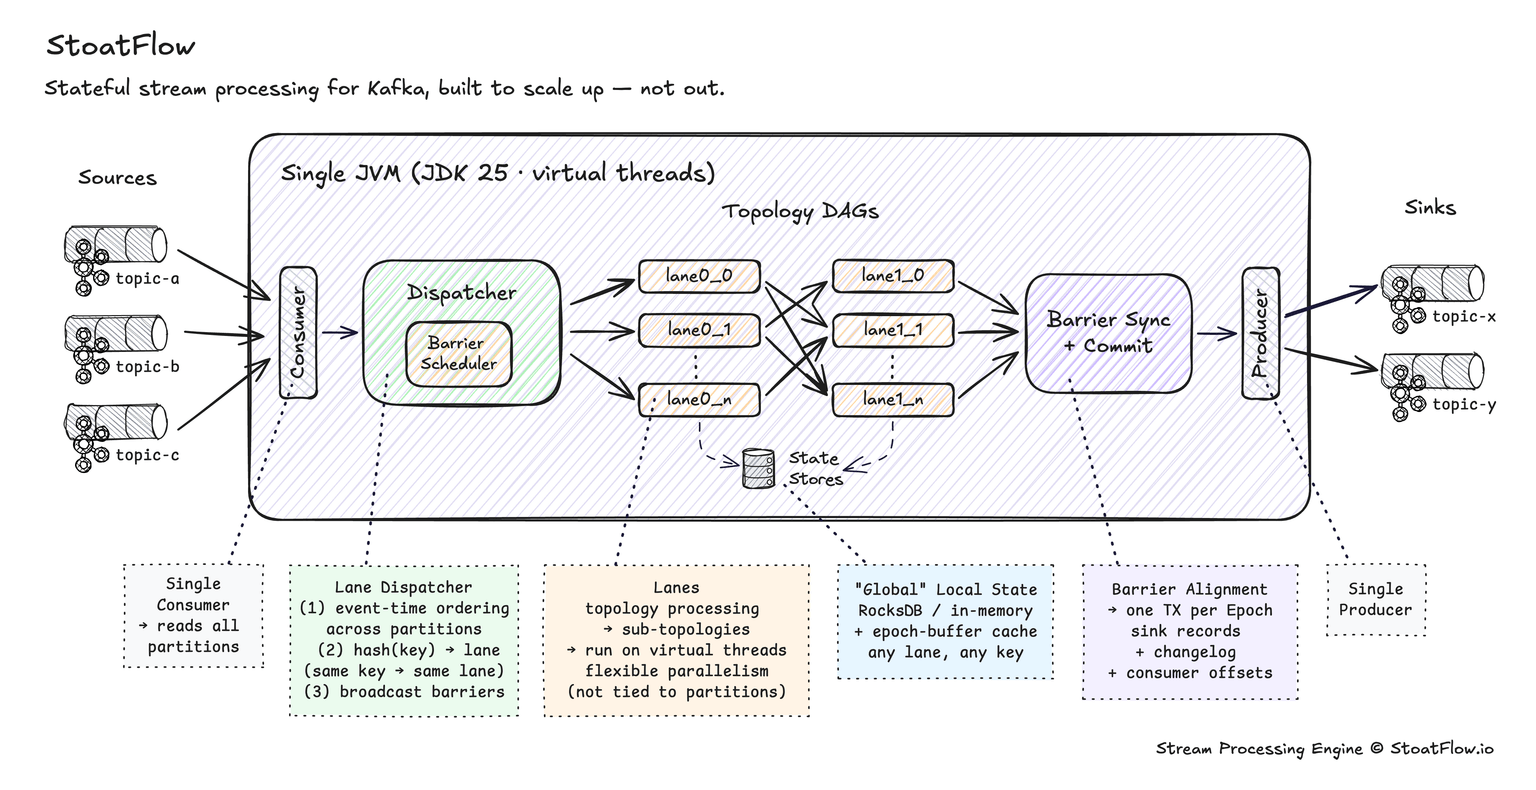
The diagram above shows the path a record takes from source topic to sink topic.
- Kafka consumer. A single consumer reads from every partition of every source topic. Records arrive in batches.
- Record dispatch. The dispatcher inspects each record's key, decides which processing lane handles it (via consistent hashing — see the next section), and places records onto per-lane queues. The dispatcher also injects commit barriers into the lanes when it's time to commit (see Exactly-once semantics below).
- Processing lanes. Each lane runs the topology — your
mapValues,filter,join,aggregate, customProcessorcode — for the records assigned to it. Stateful operators read and write state stores. - State stores. Backed by RocksDB or held in memory. Globally accessible from any lane; see the next-but-one section.
- Sink collection. Records emitted by the topology buffer in a sink collector, ready to publish to Kafka.
- Transactional producer. A single Kafka producer writes the buffered output records, updates the consumer-group offsets, and commits — under exactly-once, all three of those happen atomically on a commit barrier.
That is the full data path. There is no broker round-trip between processing steps inside the topology, no cluster shuffle, no external coordinator. Repartitioning — moving a record from one lane to another because a selectKey or groupBy changed its key — happens in-memory between lanes; there is no internal repartition topic.
Processing lanes and key affinity
A lane is a unit of concurrent processing inside the JVM. Each lane runs the topology independently of all other lanes, but against the same shared state stores.
Records are routed to lanes by key affinity. The dispatcher hashes each record's key and consistently picks one lane — same key, same lane, every time. This guarantees that for any given key, the topology processes events in the order Kafka delivered them. Different keys process in parallel.
Two consequences are worth naming:
Lane count is decoupled from Kafka partition count. In the standard Kafka Streams model, processing parallelism is bounded by the partition count of the input topics — one task per partition, with each stream thread running one or more tasks. StoatFlow doesn't have that coupling. The consumer reads all partitions, then the dispatcher distributes work across however many lanes you configure. Lane count scales with cores, not partitions.
Blocking I/O is cheap. Lanes run on virtual threads — JDK 21's GA primitive. A lane blocked on a REST call, a database query, or an AI-inference response parks at near-zero cost; the JVM keeps making progress on other lanes. This is what makes in-line external enrichment natural — no CompletableFuture chains, no reactive frameworks, no callback wiring required to keep throughput up under blocking calls.
Records that the topology re-keys with selectKey, groupBy, or a key-changing join get re-hashed and routed to a different lane. That is the in-memory equivalent of Kafka Streams' repartition topic, without the broker round-trip or extra serialization.
State stores and durability
State is global. Every state store lives in the JVM that's running the topology, and any lane can read or write any key. There's no partition-scoped isolation, no inter-instance lookup protocol — and because there's a single process holding all state, no replication of the same data across multiple JVMs.
State stores are safe under concurrent access across lanes. The correctness story falls out of key affinity (see Processing lanes above): records with the same key always route to the same lane, so updates to any given key are processed serially by one lane in arrival order. Different keys update in parallel across different lanes — no contention, no global lock. For custom Processors that need to read-modify-write multiple keys atomically (rare, but real for some patterns), the runtime provides a key-lock utility so the cross-key invariant holds without forcing single-threaded execution.
StoatFlow ships several store types — key-value, window, session, versioned (timestamped lookups), and timer — each available in a RocksDB-backed (persistent, on-disk) variant or an in-memory variant. Stateful DSL operators (count, reduce, aggregate, joins, windowed counts, suppress) choose the appropriate store type automatically. Custom Processors can declare their own.
Durability is provided by Kafka changelog topics. Every state write produces a changelog entry. Changelog topics are compacted by key, so the latest value for every key is preserved indefinitely without unbounded storage growth. State updates and the corresponding changelog publish are coupled atomically — when a commit barrier completes, you can be confident the changelog has the same data your in-memory state does.
On restart, the runtime rebuilds local state from the changelog. Restoration runs in parallel across stores so a topology with many state stores recovers concurrently rather than serially. For workloads with large state, the changelog read dominates restart time; see Benchmarks for measured cold-start numbers on representative workloads.
Exactly-once semantics — the commit barrier
Exactly-once is the conceptual centrepiece of the runtime, and the mechanism is the commit barrier.
A commit barrier is a marker — not a data record, not user content — that the dispatcher periodically injects into the lanes. As records flow through the topology the barrier flows with them. When every lane has reached the barrier, the runtime executes a single Kafka transaction that commits, atomically:
- Every state-store write since the previous barrier (via the changelog topics).
- Every sink output record produced since the previous barrier.
- The Kafka consumer-group offsets for every input partition that contributed records.
Either all three commit together, or none do. If the JVM crashes mid-barrier, the in-flight Kafka transaction aborts. The partial work — uncommitted state changes, uncommitted output records, uncommitted offset advances — is discarded. On restart, processing resumes from the previous successful barrier as if the interrupted epoch had never happened. No duplicate outputs. No lost state. No replayed offsets.
The barrier protocol is in the Chandy-Lamport family of distributed-snapshot algorithms — the lineage, and what StoatFlow's single-process scope changes about it, are on Exactly-once semantics.
At-least-once mode bypasses the barrier entirely. The producer commits its output records and the consumer commits its offsets on independent, faster cadences. You accept that on a crash some records may be processed twice and downstream consumers may see duplicates. The trade-off is a lower commit-cadence floor on end-to-end latency — useful when downstream systems are already idempotent or duplicate-tolerant.
The barrier scheduling cadence, the recovery handshake, the bounded-wait protocol for the transaction itself, and the recovery accounting are implementation concerns and stay in the source.
Event time and watermarks
Stream processing has to handle time. Records arrive out of order. Network buffers can hold a batch for an unpredictable interval. A topic with many producers carries events generated at very different wall-clock times. The runtime needs a consistent model for when did this happen that's independent of when did this arrive.
That model is event time. Every input record carries a timestamp — the Kafka record timestamp by default, or whatever a custom TimestampExtractor returns. Stateful operators that care about time (windowed aggregations, session windows, joins with time bounds) reason in event time.
A watermark is a claim made by the runtime: "I do not expect any further records earlier than time T." Watermarks are tracked per source partition; the runtime combines them into a single global watermark for the application — because there's only one application instance, there's no distributed watermark-coordination protocol. The global watermark advances together with the commit barrier, so windowed-result records are committed alongside the watermark progress that produced them — recovery sees a consistent snapshot of "what the app has seen up to."
When the global watermark passes a window's end — plus any grace period configured on the window — the runtime knows the window can close, and no further records will be accepted into it. Late records — records whose event time is older than the current watermark — are still folded into their window while it remains within its grace period, updating the result; once the window has closed, a later record that would have belonged to it is dropped. Grace is set on the window specification (for example TimeWindows.ofSizeAndGrace(...)).
Custom Processors can register event-time timers and processing-time timers that fire callbacks when the relevant clock advances past a registered moment, independent of incoming records. See Features for the watermark strategies and timer API.
Lifecycle: startup, restart, recovery
Cold start runs in three steps:
- The runtime opens a Kafka consumer in the configured group and gets every partition of every source topic assigned.
- State stores restore from their changelog topics, in parallel. For stores without a local snapshot, this reads the whole changelog; for stores with a local snapshot, only the records since the last commit need to be read.
- Once every store has caught up, the consumer seeks to the last committed input offsets and processing begins.
Clean shutdown is the reverse:
- The runtime stops accepting new records into the dispatcher.
- Records already in flight drain through the topology.
- The dispatcher injects one final commit barrier.
- When that barrier completes, the runtime commits, closes the consumer and producer, and exits.
After a crash, the flow is similar to cold start with one detail:
- The JVM exits non-cleanly; in-flight work was uncommitted, by design.
- On restart, the runtime opens the consumer at the last committed offsets — every record after that offset will be re-read.
- Local state stores may have partial in-memory data still on disk from before the crash; the runtime uses what's there as a head-start and the changelog fills the gap to the last committed barrier.
- Processing resumes. Under exactly-once, the previous epoch's partial work was aborted at the broker; downstream consumers reading with
read_committedisolation see no duplicates.
Restart times scale with state size — see Benchmarks for measured cold-start numbers on representative workloads.
Failure modes and observability
Production architecture is partly about what happens when things go right, and partly about what you observe when they don't. The runtime handles common failures with explicit, configurable policies; the admin endpoints expose the state you need to diagnose and respond.
Common failure modes
A processor throws an exception. The configured processing-exception handler decides: log and continue (skip the record), log and fail (stop the topology), or send to a dead-letter queue with the original record and error context. Silent skipping should be a deliberate choice, not an unexamined default. What you see: processor-error metrics, an error-level log entry with stack trace and record metadata, the offending record in the configured DLQ topic.
A record fails deserialization on input. Same machinery as a processor exception, with its own configurable handler. Useful for source topics that may contain malformed records — keep processing, route the broken records to a DLQ for offline inspection. What you see: deserialization-error metrics, DLQ records carrying the original key/value bytes and the offending exception.
A commit transaction times out or fails. The runtime aborts the in-flight Kafka transaction, treats it as a fatal commit failure, and exits — Kubernetes restarts the process. On restart, the previous epoch's partial work was aborted at the broker (per Kafka's transaction semantics); the new process resumes from the last successful barrier with no duplicates downstream. What you see: commit-stall metrics and the /debug/barriers endpoint show the stuck barrier before exit; the restarting instance enters the restoration phase visible via /state and /health/ready.
The Kafka broker is unavailable. Producer and consumer retry per the Kafka client's exponential-backoff defaults. Short outages cause throughput to dip and recover. Sustained outages eventually exceed configured retry budgets and trigger a fatal failure, on the same exit-and-restart pattern as a commit failure. What you see: Kafka-client error metrics, growing consumer-lag metric, /health/ready flipping to 503 once the runtime can no longer make progress.
State restoration is slow on cold start. Restoration proceeds store-by-store from the changelog topics; the time scales with state size. The /health/ready probe returns 503 until restoration completes — Kubernetes won't route traffic, and load balancers won't think the instance is ready. What you see: /health/ready returns 503 with the stoatflow health component reporting the lifecycle state (VALIDATING_STATE / RESTORING); per-store restoration progress is exposed on /metrics via the stoatflow.restoration.* meters (stores completed vs total, records and bytes restored per store_name); /state reports the lifecycle state and its transition history.
Always-on observability
For steady-state diagnostics and capacity planning, the admin endpoints expose:
- Health probes —
/health/liveand/health/readyfor Kubernetes or any HTTP-probe-aware orchestrator. - Prometheus metrics —
/metricsexposes JVM, Kafka-client, and StoatFlow internal counters in the standard Prometheus format. Scrape from your existing monitoring stack; no agents to install. - Topology introspection —
/topologyrenders the processor DAG;/statereports lifecycle state and transition history;/watermarksshows per-partition watermark state. - Debug endpoints —
/debug/threadsand/debug/barriersgive live views of every lane's thread state and the commit-barrier coordinator. Useful when a topology behaves unexpectedly and you need to see exactly what every lane is doing right now. - Plugin and lifecycle hooks — register custom indicators, listeners, or shutdown hooks programmatically. User code can run on
PRE_START,POST_START,PRE_STOP, andPOST_STOP. - Logs — emitted through SLF4J/Logback; per-logger levels are adjustable from the runtime's
logging:configuration group without touchinglogback.xml, and JSON output plugs in through standard Logback encoder configuration.
Where to go next
- Features — every distinguishing capability, by area
- Motivation — why StoatFlow is built this way
- Comparison matrix — feature-by-feature against Kafka Streams and self-hosted / managed Flink
- Benchmarks — measured throughput, latency, resource use, cold-start times
- Migration — porting an existing Kafka Streams topology
Core concepts
A map of the StoatFlow concept pages and the order to read them in — from the single-instance architecture through exactly-once, lanes, state, event time, configuration, and error handling.
Exactly-once semantics
How StoatFlow's commit barrier delivers end-to-end exactly-once — one Kafka transaction commits state, output, and offsets atomically — plus crash recovery and the at-least-once trade-off.