Benchmarks
StoatFlow vs Kafka Streams 4.1 — four representative workloads, EOS and ALO modes, plus state restoration. Run 2026-04-22 on Hetzner ccx33 (8 vCPU / 32 GB RAM).
These numbers compare a StoatFlow build (EOS Phase 6b, ALO Phase 8) against a stable Apache Kafka Streams 4.1.1 baseline on identical hardware, identical broker, identical workload. The intent is to be useful, not promotional — full topology, load profile, methodology, and the cases where StoatFlow is only at parity or measurably behind Kafka Streams are all in scope below.
All runs originate from the internal benchmark report dated 2026-04-22. The numbers below transcribe that report verbatim.
Setup
Hardware
| Component | Value |
|---|---|
| Benchmark app node | Hetzner ccx33 — 8 dedicated vCPU, 32 GB RAM |
| Container limits (app) | 8 CPU, 16 GB memory |
| Kafka brokers | 3× Hetzner cpx32 — 4 shared vCPU, 8 GB RAM, 160 GB SSD each — co-located with the k3s control plane and the monitoring stack (Prometheus, Grafana) |
| Region | nbg1 (Nuremberg) |
| Orchestration | k3s on Hetzner Cloud |
Kafka & runtime
| Component | Value |
|---|---|
| Kafka broker | 4.1.1 (Strimzi 0.50.0 operator) |
| JDK | 25 (preview features enabled; required for StoatFlow's virtual-thread runtime) |
| StoatFlow EOS commit barrier | commit-barrier.min-interval-ms=130, adaptive scheduling (post-commit feedback clamps barrier-to-barrier interval between configured min and max) |
| Kafka Streams EOS commit interval | 100 ms (default commit.interval.ms) |
What's controlled, what's varied
Topology, input data, load profile, partition count, broker, hardware, and run duration are identical across the two runtimes for any given comparison. The only variable is the runtime itself (StoatFlow vs Kafka Streams) and the processing mode (EOS vs ALO).
Each run executes for 20 minutes total: a 10-minute warmup (JIT, GC stabilisation, lag catch-up) followed by a 10-minute measurement window at steady state. Topics are recreated between runs; state is empty at start.
Methodology
Latency
True E2E P50 / P95 / P99 is measured from the downstream-consumer's point of view — the latency a real service reading the output topic would actually observe. A dedicated latency-consumer pod simulates that downstream application: it subscribes to the output topic with isolation.level=read_committed (so a record only becomes visible after the producing transaction commits) and, for every consumed record, computes consumption time − record timestamp. Percentiles are derived over the entire measurement window, not from averages.
The read_committed isolation is deliberate. Under EOS, downstream consumers can't see records before the producing transaction commits — which means the runtime's commit cadence is part of the user-observable latency (StoatFlow's 130 ms minimum barrier interval — adaptively scheduled — and Kafka Streams' default 100 ms commit.interval.ms). An internal produce-time measurement would hide that cost.
The latency-consumer adds ~10–15 % measurement overhead through the extra consume-and-timestamp cycle. Percentile relative comparisons between runtimes hold; absolute latency on a runtime without a latency-consumer would be slightly lower.
Resource utilisation
CPU, JVM heap, container working set, GC pause durations, and thread counts are sampled from Prometheus at 10-second resolution and averaged over the measurement window. GC pause is the per-event JVM Stop-the-World duration, not the cumulative GC time.
Repeatability
Throughput is defined and controlled by the load generators — produced rec/s mirrors the configured input rate, predictable and repeatable across runs. Latency, CPU, memory, and GC numbers in the result tables are sampled from each run and should be read as point estimates rather than statistical means.
Scenario A — Stateless (simple)
Topology
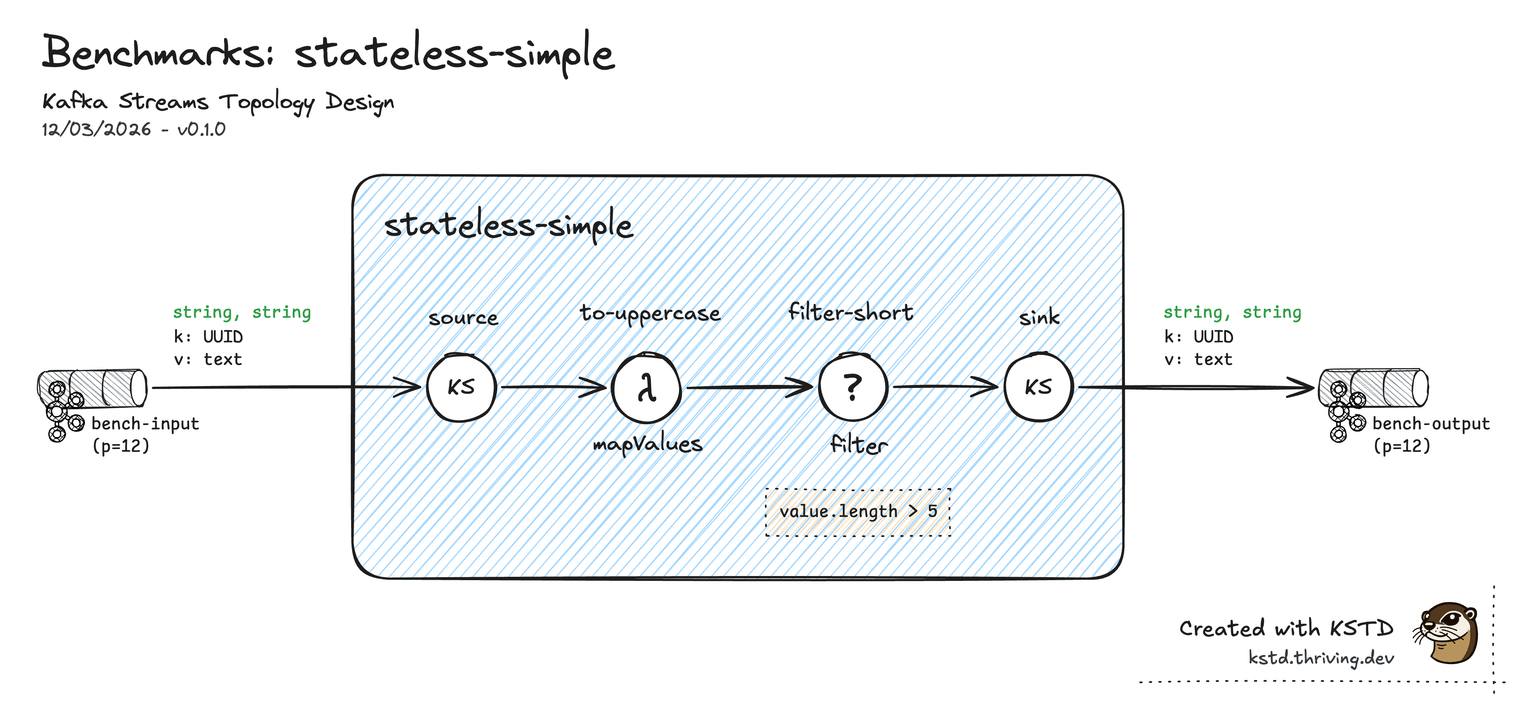
A minimal stateless pipeline: one source topic → mapValues (uppercase) → filter (length > 5) → one sink topic. No state, no repartitioning, no joins. The simplest possible topology — used to measure pure framework overhead.
Data & load profile
| Property | Value |
|---|---|
| Serdes | String / String |
| Record size | ~1,024 bytes (fixed) |
| Partitions | 12 |
| Distinct keys | 10,000 |
| Load | 20,000 msg/s |
| Total records / run | ~12.3M |
Results — EOS
| Metric | KS | StoatFlow | Δ | Notes |
|---|---|---|---|---|
| True E2E P50 (ms) | 100.2 | 124.0 | +24% | KS wins |
| True E2E P95 (ms) | 163.7 | 191.8 | +17% | KS wins |
| True E2E P99 (ms) | 180.0 | 201.9 | +12% | KS wins |
| Avg CPU (cores) | 1.3 | 1.3 | 0% | parity |
| Avg heap (MB) | 93 | 62 | −33% | |
| Avg container mem (MB) | 432 | 504 | +17% | KS uses less |
| Avg GC pause (ms) | 4.3 | 3.1 | −28% |
True E2E P95 latency
17% higher
CPU utilisation
parity
Container memory
17% more
This is the scenario where StoatFlow's EOS commit cadence is most exposed: with no state store cost and trivial per-record work, StoatFlow's 130 ms minimum barrier interval runs a touch slower than KS's 100 ms commit.interval.ms. The ~30 ms cadence delta accounts for essentially all of the observed ~24 ms True E2E P50 gap. ALO drops the barrier cadence entirely and the gap inverts (see below).
Results — ALO
| Metric | KS | StoatFlow | Δ | Notes |
|---|---|---|---|---|
| True E2E P50 (ms) | 45.3 | 41.9 | −8% | |
| True E2E P95 (ms) | 65.3 | 61.5 | −6% | |
| True E2E P99 (ms) | 75.0 | 71.6 | −5% | |
| Avg CPU (cores) | 1.2 | 1.2 | 0% | parity |
| Avg heap (MB) | 97 | 197 | +103% | KS uses less |
| Avg container mem (MB) | 430 | 657 | +53% | KS uses less |
| Avg GC pause (ms) | 3.8 | 1.3 | −66% |
True E2E P95 latency
6% lower
CPU utilisation
parity
Container memory
53% more
In ALO, StoatFlow recovers a small latency lead but uses substantially more container memory on this scenario — the in-memory buffer and virtual-thread stack overhead dominate when there's no state store to amortise over. The GC pause delta (−66 %) goes the other way.
Scenario B — Word count
Topology
Canonical stateful aggregation: source → flatMapValues (tokenise on whitespace) → groupBy(word) → count (RocksDB) → toStream → output. Implicit repartitioning between groupBy and count: Kafka Streams writes to a Kafka-hosted repartition topic; StoatFlow re-keys in memory.
Data & load profile
| Property | Value |
|---|---|
| Serdes | String / Long |
| Record size | ~200 bytes avg (range 50 – 1,000) |
| Partitions | 12 |
| Distinct word keys | ~1,000 |
| Load | 7,500 msg/s |
| Total records / run | ~4.6M |
| State | 1 RocksDB store (word counts) |
Results — EOS
| Metric | KS | StoatFlow | Δ | Notes |
|---|---|---|---|---|
| True E2E P50 (ms) | 155.3 | 120.7 | −22% | |
| True E2E P95 (ms) | 197.4 | 191.9 | −3% | parity |
| True E2E P99 (ms) | 215.0 | 201.7 | −6% | |
| Avg CPU (cores) | 3.0 | 2.2 | −27% | |
| Avg heap (MB) | 724 | 406 | −44% | |
| Avg container mem (MB) | 1,769 | 1,219 | −31% | |
| Avg GC pause (ms) | 6.4 | 1.1 | −83% |
True E2E P95 latency
3% lower
CPU utilisation
27% less
Container memory
31% less
Results — ALO
| Metric | KS | StoatFlow | Δ | Notes |
|---|---|---|---|---|
| True E2E P50 (ms) | 39.8 | 39.4 | −1% | parity |
| True E2E P95 (ms) | 65.0 | 54.3 | −16% | |
| True E2E P99 (ms) | 72.4 | 62.3 | −14% | |
| Avg CPU (cores) | 3.5 | 1.8 | −49% | |
| Avg heap (MB) | 759 | 771 | +2% | parity |
| Avg container mem (MB) | 2,278 | 2,323 | +2% | parity |
| Avg GC pause (ms) | 3.1 | 0.7 | −77% |
True E2E P95 latency
1.2× lower
CPU utilisation
1.9× less
Container memory
parity
Scenario C — Stateless (advanced)
Topology
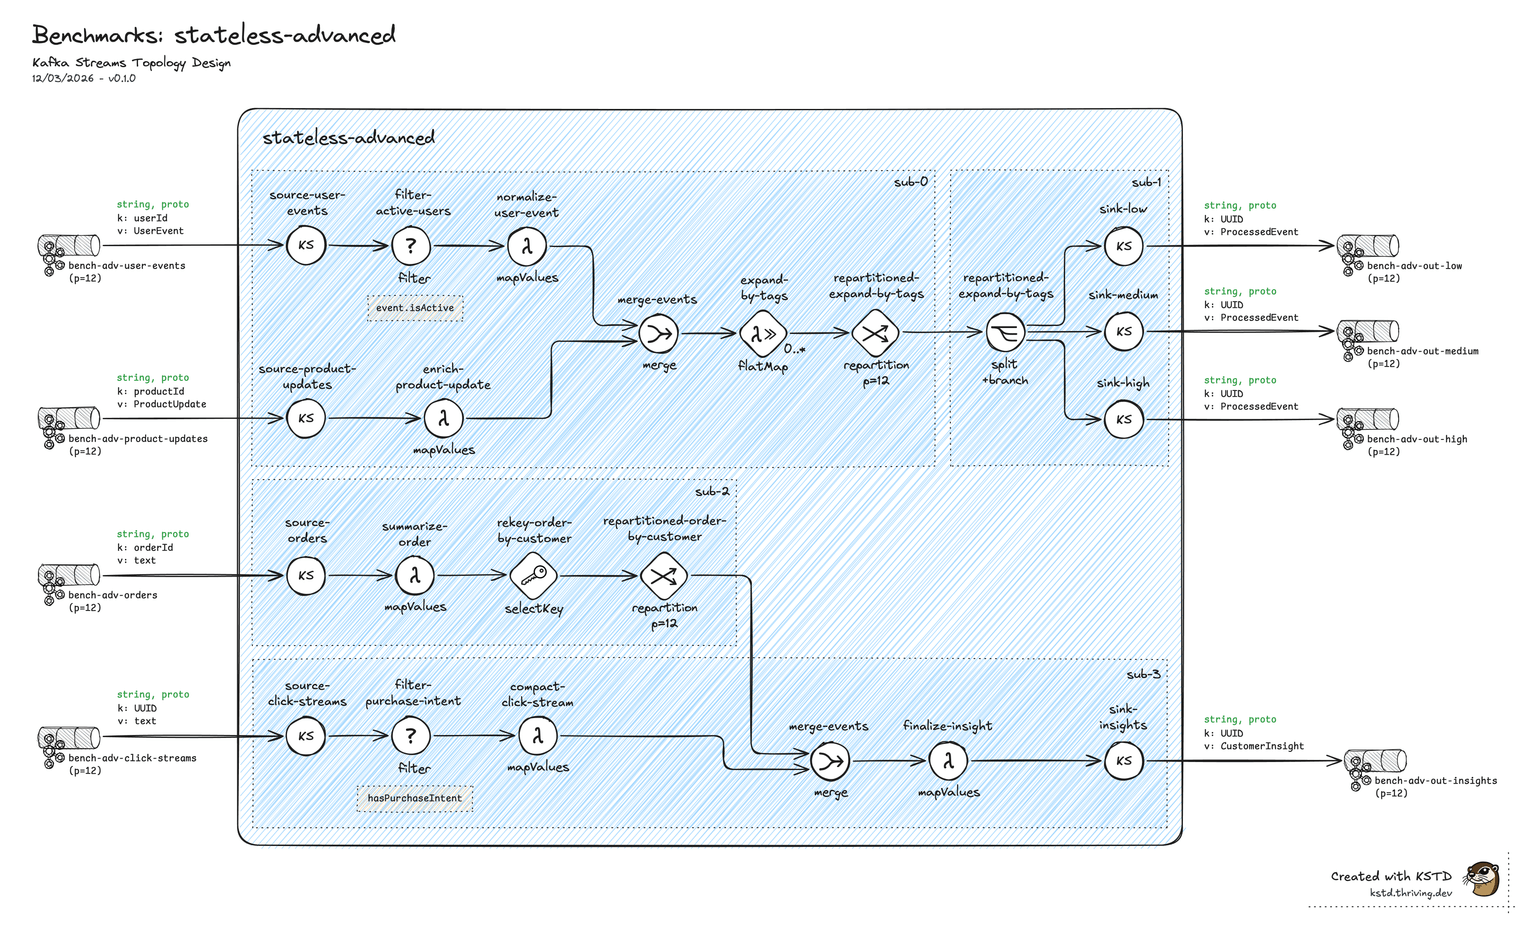
Two independent processing paths over four Protobuf input streams:
- Path A:
user-events+product-updates→ merge →flatMap(tag expansion, 1 → N fan-out) → repartition → split by priority → 3 output topics. - Path B:
orders+click-streams→ filter/transform → merge → repartition bycustomerId→ 1 output topic.
Two explicit repartitions, four inputs, four outputs, no state.
Data & load profile
| Property | Value |
|---|---|
| Serdes | Protobuf (all topics) |
| Record size | user-events / product-updates 2 – 5 KB · orders 8 – 15 KB · click-streams 15 – 30 KB |
| Partitions | 12 per topic |
| Load | 2,100 + 1,400 + 700 + 2,800 = 7,000 msg/s total |
| Total records / run | ~4.3M |
Results — EOS
| Metric | KS | StoatFlow | Δ | Notes |
|---|---|---|---|---|
| True E2E P50 (ms) | 217.6 | 116.4 | −47% | |
| True E2E P95 (ms) | 338.4 | 181.0 | −47% | |
| True E2E P99 (ms) | 413.9 | 196.5 | −53% | |
| Avg CPU (cores) | 2.3 | 1.0 | −57% | |
| Avg heap (MB) | 480 | 141 | −71% | |
| Avg container mem (MB) | 1,252 | 518 | −59% | |
| Avg GC pause (ms) | 1.7 | 2.9 | +71% | KS wins |
True E2E P95 latency
1.9× lower
CPU utilisation
2.3× less
Container memory
2.4× less
Results — ALO
| Metric | KS | StoatFlow | Δ | Notes |
|---|---|---|---|---|
| True E2E P50 (ms) | 50.3 | 37.3 | −26% | |
| True E2E P95 (ms) | 79.0 | 52.0 | −34% | |
| True E2E P99 (ms) | 91.8 | 60.8 | −34% | |
| Avg CPU (cores) | 2.6 | 1.1 | −58% | |
| Avg heap (MB) | 810 | 128 | −84% | |
| Avg container mem (MB) | 1,654 | 506 | −69% | |
| Avg GC pause (ms) | 1.1 | 2.6 | +136% | KS wins |
True E2E P95 latency
1.5× lower
CPU utilisation
2.4× less
Container memory
3.3× less
Scenario D — Stateful joins
Topology
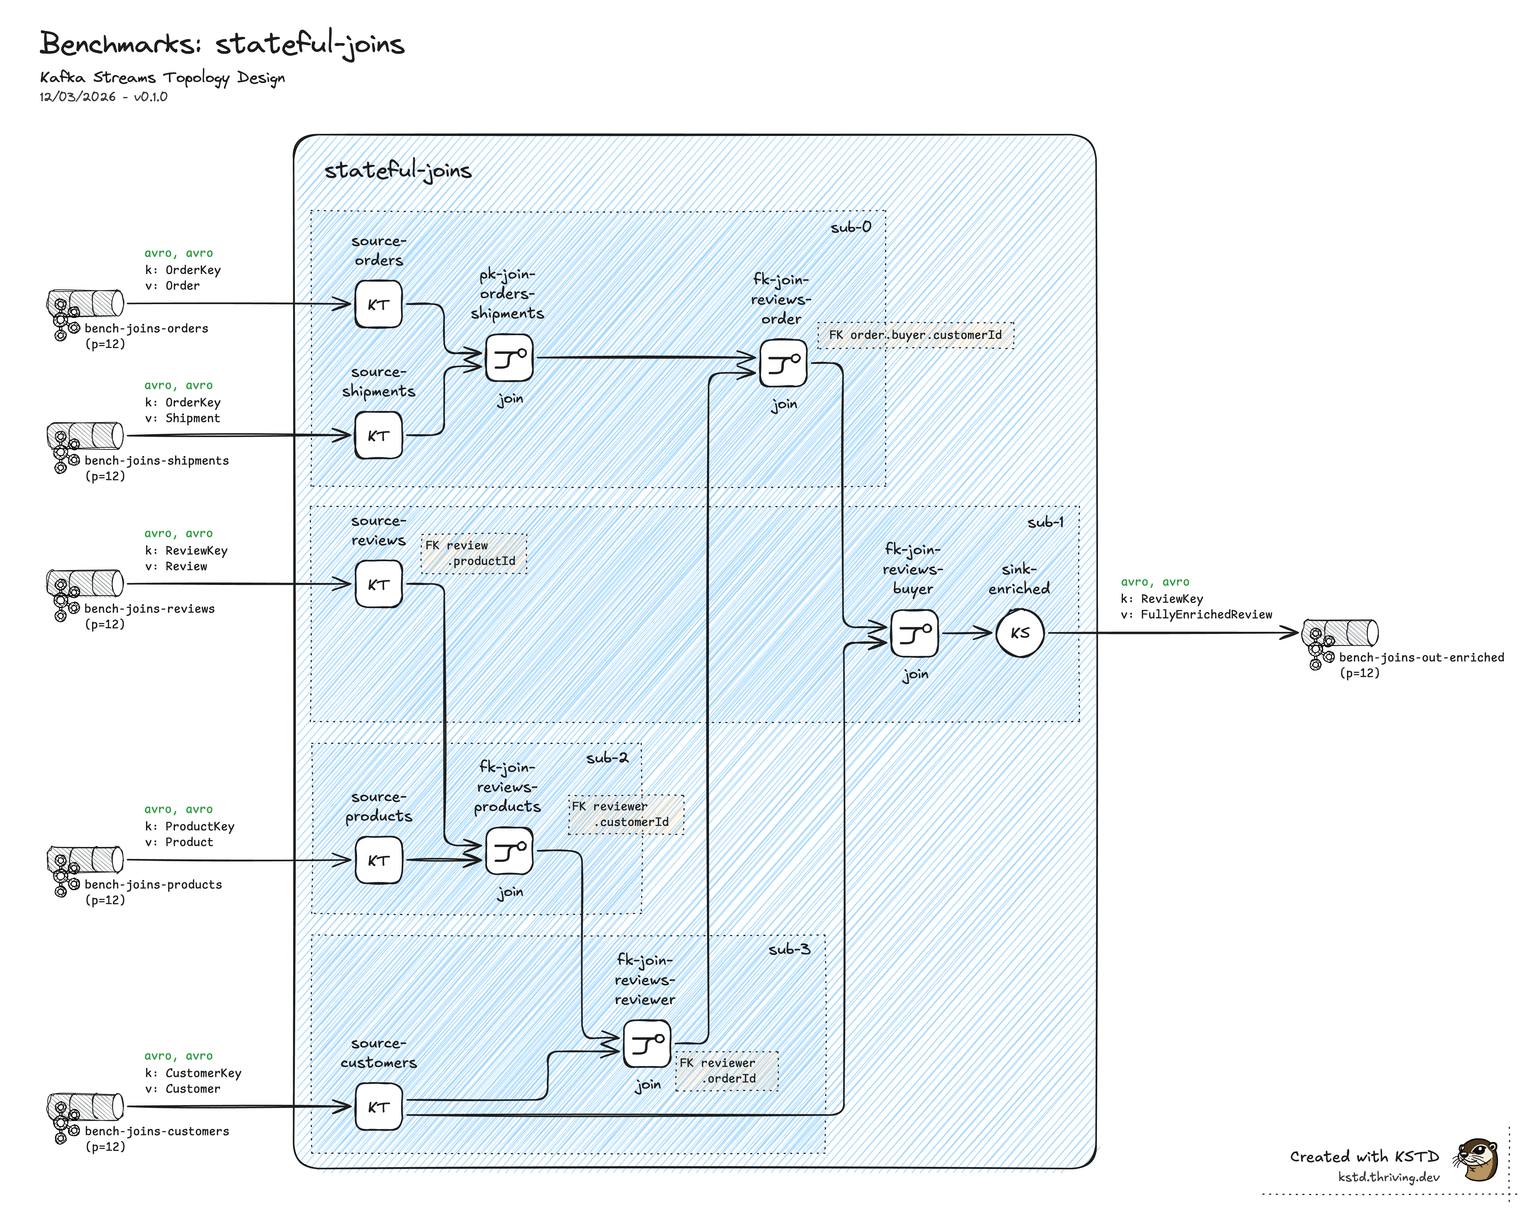
Five-table enrichment chain: customers + products + orders + shipments + reviews. One primary-key join (orders ⋈ shipments) plus four foreign-key joins. Output: fully enriched record per order. Ten-plus RocksDB state stores (one per input table plus join intermediates). Avro with Schema Registry.
Data & load profile
| Property | Value |
|---|---|
| Serdes | Avro + Confluent Schema Registry |
| Record size | customers / products 2 – 5 KB · orders 10 – 50 KB · shipments 5.5 – 27 KB · reviews 5.5 – 20 KB |
| Partitions | 12 per input topic |
| Load | 12 + 18 + 120 + 90 + 60 = 300 msg/s total |
| Total records / run | ~184 K |
| State | 10+ RocksDB stores |
Results — EOS
| Metric | KS | StoatFlow | Δ | Notes |
|---|---|---|---|---|
| True E2E P50 (ms) | 1,594.5 | 144.4 | −91% | |
| True E2E P95 (ms) | 2,914.9 | 214.2 | −93% | |
| True E2E P99 (ms) | 3,297.9 | 242.8 | −93% | |
| Avg CPU (cores) | 4.3 | 2.9 | −33% | |
| Avg heap (MB) | 1,775 | 194 | −89% | |
| Avg container mem (MB) | 8,667 | 1,105 | −87% | |
| Avg GC pause (ms) | 13.7 | 8.2 | −40% |
True E2E P95 latency
13.6× lower
CPU utilisation
1.5× less
Container memory
7.8× less
Results — ALO
| Metric | KS | StoatFlow | Δ | Notes |
|---|---|---|---|---|
| True E2E P50 (ms) | 267.9 | 39.8 | −85% | |
| True E2E P95 (ms) | 562.9 | 55.0 | −90% | |
| True E2E P99 (ms) | 703.8 | 63.0 | −91% | |
| Avg CPU (cores) | 6.8 | 2.0 | −71% | |
| Avg heap (MB) | 1,301 | 485 | −63% | |
| Avg container mem (MB) | 7,932 | 1,802 | −77% | |
| Avg GC pause (ms) | 14.6 | 8.0 | −45% |
True E2E P95 latency
10.2× lower
CPU utilisation
3.4× less
Container memory
4.4× less
State restoration
Separate benchmark — cold-start recovery from pre-populated changelog topics, no live processing. Measures the wall-clock time and resource cost of materialising a full state set.
Setup
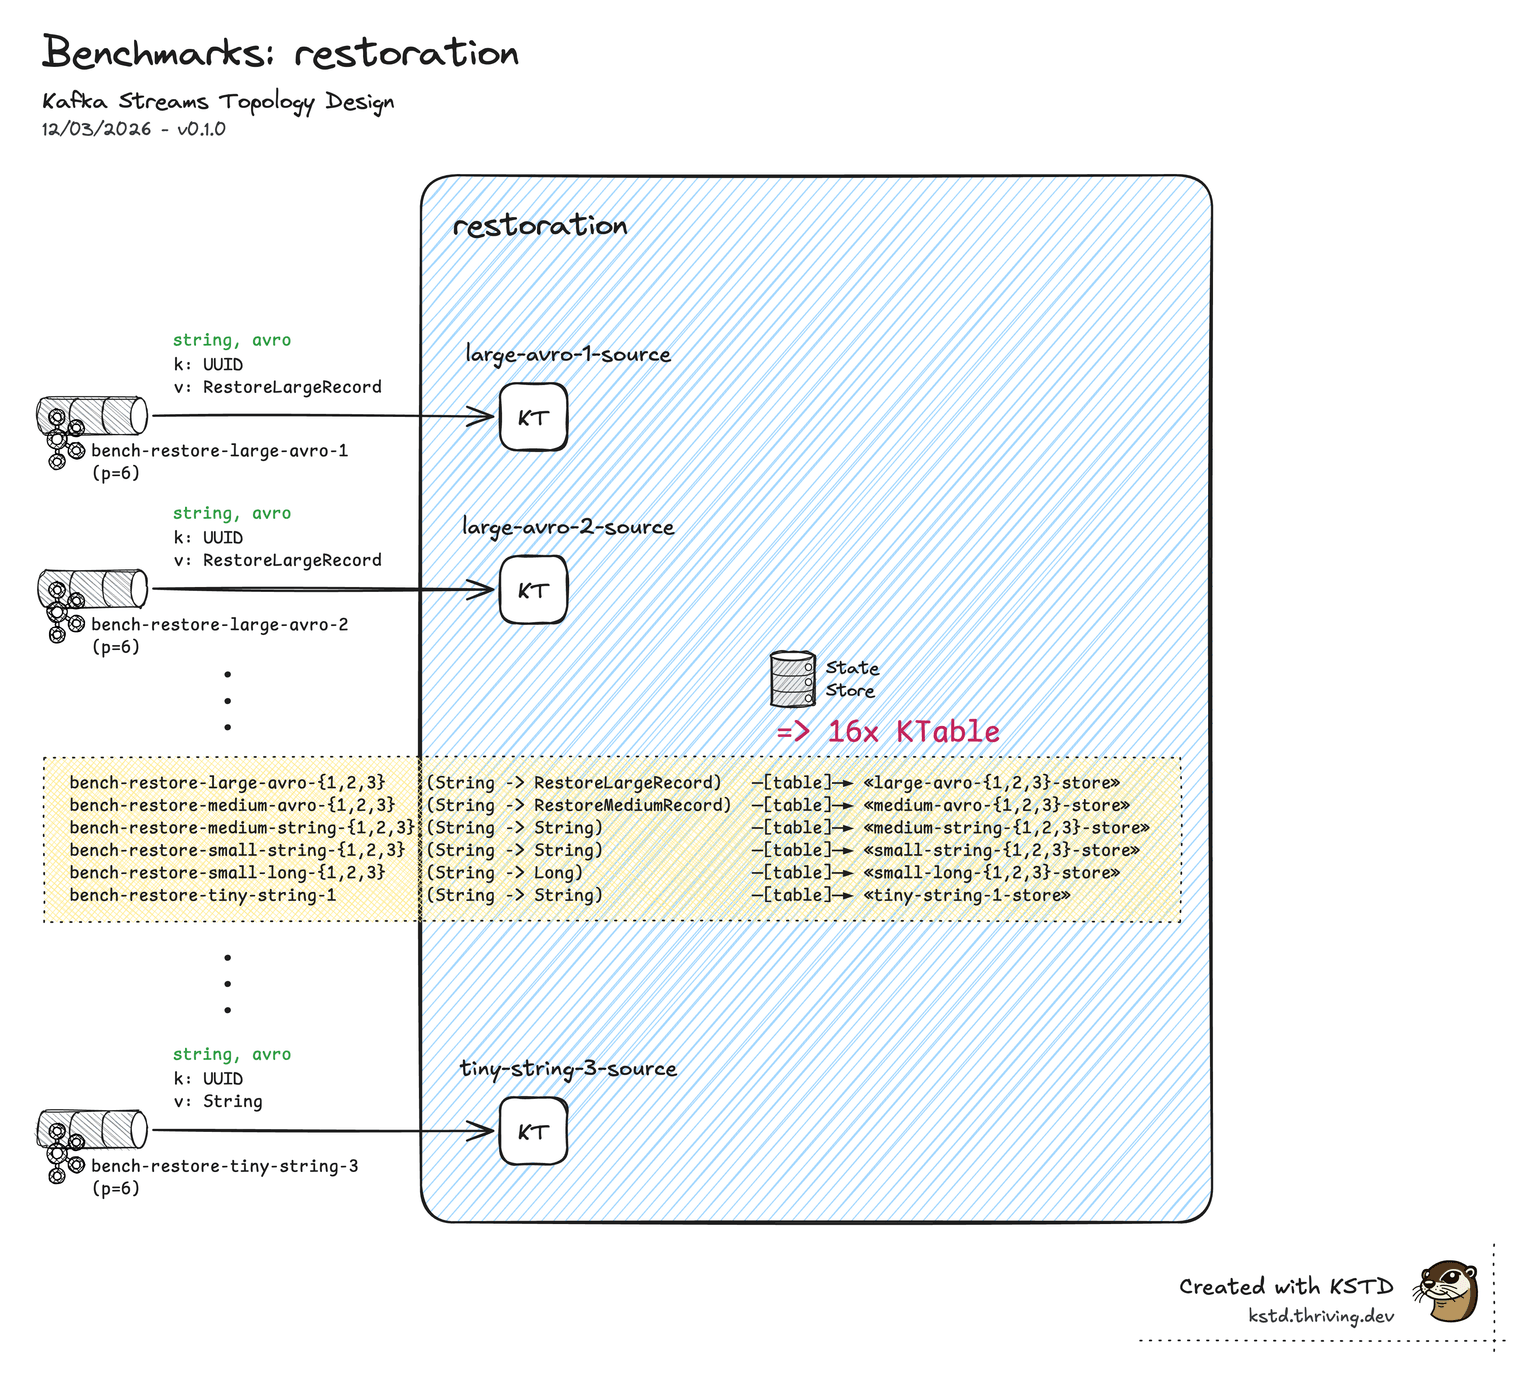
| Property | Value |
|---|---|
| Stores | 16 KTable source stores |
| Partitions per store | 6 |
| Total records | ~155.8M |
| Raw data | ~16.8 GB |
| Serdes | Mixed Avro / String |
StoatFlow offers two restoration modes:
WriteBatch HIGH_PERF— RocksDBWriteBatchingestion. Lower memory overhead, recommended default.SST HP buf128— direct SST file ingestion with a 128 MB per-worker sort buffer. Lower wall-clock time, substantially higher memory ceiling.
Results
| Metric | KS | StoatFlow · WriteBatch | StoatFlow · SST |
|---|---|---|---|
| Total time (s) | 183 | 127 (1.45× faster) | 111 (1.65× faster) |
| Aggregate throughput (M rec/s) | 0.87 | 1.23 | 1.41 |
| Avg CPU (cores) | 6.88 | 6.17 | 7.79 |
| Avg container memory (MB) | 5,616 | 4,690 | 18,105 |
| On-disk RocksDB (GB) | 16.5 | 10.8 | 10.2 |
Total restoration time
On-disk RocksDB footprint
Avg container memory
When to use which mode
- WriteBatch (default) — broadly applicable. Wall-clock 1.45× faster than KS, lower memory than KS, smaller on-disk footprint. The right starting point unless restoration time is the binding production constraint.
- SST ingestion — when first-byte-after-restart latency matters and the deployment has memory headroom. ~3.2× the container memory of WriteBatch during the restoration window; the same memory profile during steady-state.
Where StoatFlow is at parity or behind
A short list of cases where the numbers don't favour StoatFlow — included so the page reads as data, not as advocacy.
EOS latency on the simplest topology
On Stateless (simple) in EOS mode, Kafka Streams beats StoatFlow on every latency percentile: P50 by 24 %, P95 by 17 %, P99 by 12 %. Root cause: StoatFlow's commit pipeline runs at a 130 ms minimum barrier interval (commit-barrier.min-interval-ms; the adaptive scheduler clamps barrier-to-barrier between the configured min and max via post-commit feedback). KS's default commit.interval.ms=100 produces a slightly tighter cadence on workloads where the commit itself dominates the latency budget. The ~30 ms cadence delta accounts for essentially the entire ~24 ms P50 gap. In ALO mode (no transactions, no barrier cadence) StoatFlow recovers and shows a small latency lead, so the gap is specific to EOS-on-simple-topologies. The minimum barrier interval is a tunable; lowering it further narrows the EOS gap at the cost of commit-pipeline throughput.
Container memory on Stateless (simple) ALO
In ALO mode on the simplest topology, StoatFlow uses +53 % container memory (657 MB vs 430 MB). GC pause time is 2.9× lower in the same comparison — a different point on the same trade-off — but the working-set figure is larger, and a memory-constrained deployment should know that. The delta does not appear on more substantial workloads, where state-store memory dominates.
GC pause on Stateless (advanced)
GC pause averages run +71 % in EOS and +136 % in ALO vs Kafka Streams on this scenario (2.9 ms vs 1.7 ms; 2.6 ms vs 1.1 ms). Absolute pause times remain under 3 ms in both runtimes, so the relative figure overstates the practical impact, but it's a genuine regression on this workload shape (high-fanout flatMap on relatively large records).
Not yet benchmarked
The following are explicitly out of the current measurement set. Numbers here are not just unfavourable — they are absent.
- Scaling beyond 8 vCPU. All numbers above are on a single Hetzner ccx33. Larger boxes (16+ vCPU, 64+ GB) are extrapolated from microbenchmarks of the lane dispatcher and have not been validated end-to-end at scale.
- Custom processor DAGs with deep fan-out. Only the four scenarios above were measured. Topologies with many sub-topologies (10+) may behave differently.
StoatFlow at the time of these runs is in active development (EOS Phase 6b, ALO Phase 8); Kafka Streams 4.1.1 is a stable production release. Later StoatFlow phases may improve or regress against these numbers.
What's next
Two benchmark expansions are planned for upcoming runs.
Higher-load runs on AWS EKS
16-core compute-optimized nodes for both the application tier and the Kafka broker tier, with substantially higher network and disk-IO bandwidth than the current Hetzner ccx33 baseline. Goal: stress sustained throughput beyond the single-machine measurements above, validate the vertical-scale assumption past 8 vCPU end-to-end (currently extrapolated from microbenchmarks), and push past the ~380 MB/s broker-fetch ceiling that bounds State restoration today.
Additional benchmark apps
Coverage of all window types (tumbling, hopping, sliding, session) and stream-stream joins — neither is exercised today; the current set covers stateless transforms, key changes, aggregations, and primary-key + foreign-key table joins. Plus more complex topologies modelling real-world use cases, driven by production-like test-data workloads — record-size distributions, key cardinality, arrival patterns, and foreign-key relationships that actually resolve at join time (not random keys that mostly miss) — instead of the synthetic load profiles used in the current runs.