
Testing and operating event time

The TopologyTestDriver keeps one clock: stream time is the maximum event time it has seen, advanced by every record you pipe in, with no out-of-orderness lag and no minimum: one watermark for every topic you pipe, the largest timestamp seen on any of them. Production keeps the clock part 1 described: a 10-second lag by default, and a minimum across every partition of every source. So a window-close or join-timing test that passes in the driver emits later on a real broker, and can count a record the driver dropped. It is the loudest rule in the stoatflow-test skill and a callout on the testing page; this post is the operator's half of the series.
TL;DR
- What: the test-time and run-time surface of event time —
TopologyTestDriverdivergences and mitigations,GET /watermarks, thestoatflow.watermark.*andstoatflow.dropped.records.totalmeters, the two alerts, the three config keys, and restart / failover behaviour.- Why: the driver's clock is Kafka Streams-shaped and production's is not; a green unit test says nothing about emission timing under a real out-of-orderness bound and a real partition minimum.
- How: drive the watermark explicitly in tests; if production must behave like the driver, give it zero lag (
forMonotonousTimestamps()ormax-out-of-orderness-ms: 0— in the driver itself the generator never runs); put timing assertions in a broker test; in production readstoatflow.watermark.currentandlag.msat info level and alert on a stalled watermark while the app isRUNNING.- The catch: the driver's clock can drop an out-of-order record the engine still counts;
stoatflow.watermark.late.records.totalis debug-level, off in a default deployment;Joined.withGracePeriodis advisory and silently ignored (grace comes from the window definition);stoatflow.topology.event.time.tracking = 0means the engine decided your topology has no event time, and you should check that it is right.- Docs: Testing · Metrics · Metrics reference · REST API reference.
In this post
- The driver is not the engine
- Reading /watermarks
- The meters that matter
- One alert on day one
- The three knobs
- Restart, failover, migration
- Tradeoffs and limits
- What's coming next
The driver is not the engine
The divergence is exact, and it is recorded as such in the compatibility register. The driver holds one number for event time and raises it to the maximum of itself and each piped record's timestamp. The source's WatermarkStrategy is consulted for its timestamp assigner and nothing else — its watermark generator is never created — so a forBoundedOutOfOrderness(30 s) source contributes zero lag in a test. It is one number for every topic you pipe, so there is no minimum across partitions. The final emission runs synchronously, on the very pipe that carries the watermark past windowEnd + grace: no punctuation lane and no commit-interval lag, because with one thread and no lanes the race part 3 closes cannot occur. What the driver does keep is the engine's late-drop floors: a piped record is judged against the current watermark, punctuators and an advance's closing flush against the watermark the previous advance flushed, and timers and the barrier-gated suppress flush against the last barrier's watermark. The rules that decide whether a record counts are the engine's; only the clock under them differs.
The engine has none of those simplifications. Its watermark trails the newest data by the bound, follows the slowest partition, and a final result appears up to two commit intervals after it crosses the close. So a test that pipes a record past the close and asserts the final result on the next line is correct in the driver and early on a broker — by the bound, then by up to two commit intervals — and nothing is wrong with either side. The rule for a late record is the same in both: it is late when its window's close time is at or before the floor of the thread processing it. But the floors stand on different clocks — the driver's is the largest timestamp it has seen, the engine's is the watermark stamped on the last barrier, which trails the newest data by the bound and follows the slowest partition. So the driver can drop an out-of-order record that the engine still counts, and a test of what is counted needs the same care as one of when.
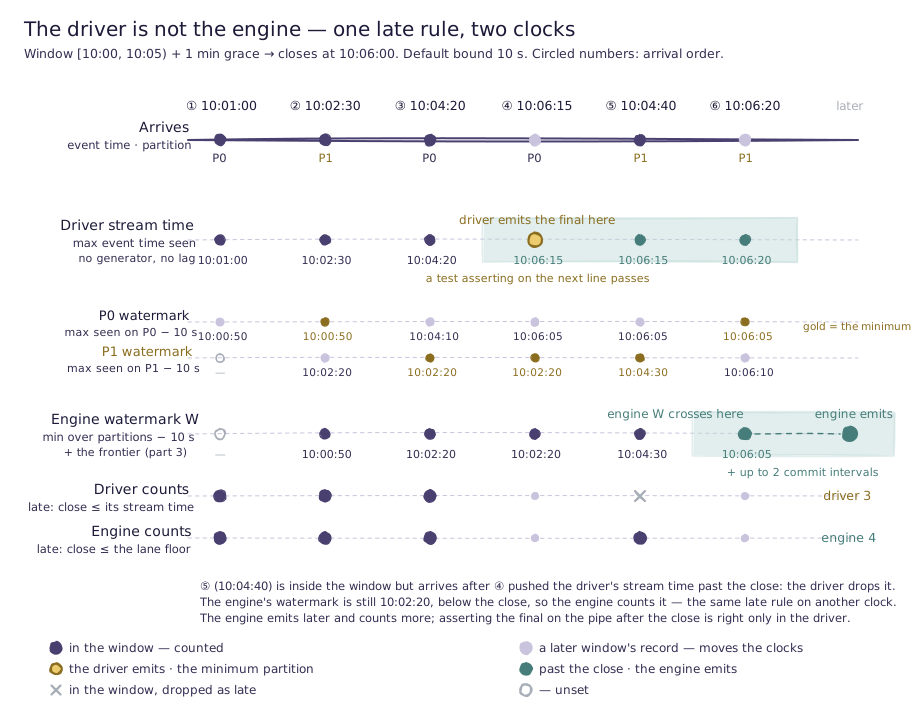
Read the two clock rows against the same six arrivals. The driver's stream time crosses 10:06:00 at ④, a record from the next window, and emits the final count of three on that pipe. The engine's watermark is the minimum over the two partitions, less ten seconds, and P1 is behind: it crosses only at ⑥, when P1's own record from the next window arrives, and the emission itself follows at a barrier the axis cannot show. Record ⑤ — inside the window, arriving between the two crossings — is where they part: the driver's clock has already passed the close, so the driver drops it, while the engine's watermark still sits below 10:06:00, so the engine counts it. The driver emits three, the engine four.
Three smaller facts matter for test design. advanceWatermark is lenient by default — a backward request is a silent no-op, since every pipe already drives event time forward — and throws only under test.driver.commit-per-pipe=false, the legacy manual mode. advanceWallClockTime fires processing-time timers, WALL_CLOCK_TIME punctuators and wall-clock and cron scheduled sources, then commits a barrier; it never moves event time. And because the default commits after every pipe, Suppressed.untilBarrier() looks eager in the driver — one emission per record — so a test of epoch consolidation has to turn the flag off and call commitBarrier() itself. The driver also refuses, when it is built, every topology the engine refuses to start because a watermark can never drive it — a window, suppress, stream–stream join, event-time timer or STREAM_TIME scheduled source beside a noWatermarks() source, under DISABLED coordination, or with no Kafka topic to read — so that failure shows in the unit test, not on deploy.
The mitigations, in order. First, if a broker must behave like the driver, run production with zero lag — forMonotonousTimestamps() on the source, or max-out-of-orderness-ms: 0 — so "the watermark passed end + grace" means the same thing in both. In the driver itself it changes nothing: the generator never runs. Second, drive event time explicitly with advanceWatermark rather than through the next record's timestamp — it states the intent, and survives a reordered fixture.
// No lag in production either, so "the watermark passed end + grace" means the same thing on a broker.
val consumed = Consumed.with(Serdes.String(), Serdes.Long())
    .withWatermarkStrategy(WatermarkStrategy.forMonotonousTimestamps())

// ...pipe records, then advance the watermark explicitly instead of relying on the next record's timestamp:
driver.advanceWatermark(windowEnd + graceMs + 1)
assertThat(output.readKeyValuesToList()).containsExactly(/* the final result */)
Third, put timing assertions in a broker test — Testcontainers, the real bound, the real minimum, the real barrier cadence — and let the driver test assert what is emitted rather than when. Fourth, never assert on wall clock in either. The testing page now carries this as a callout; it should have from the start.
Reading /watermarks
GET /watermarks is the endpoint that makes a stall attributable. It returns 503 only while the engine is not initialised, or when no partition has registered and no watermark has been emitted; a topology that has registered partitions but not yet emitted a watermark answers 200 with globalMs at Long.MIN_VALUE and globalIso: "N/A". /info carries the global watermark alone (globalMs, globalIso) unless runtime.endpoints.info.show-watermarks is off; the per-partition view is only on /watermarks. Trimmed to two partitions, one of them idle:
{
  "globalMs": 1790071560000,
  "globalIso": "2026-09-22T10:06:00Z",
  "alignmentGroupMins": {},
  "alignmentBinding": null,
  "partitions": {
    "orders:0": {
      "watermarkMs": 1790071560000, "watermarkIso": "2026-09-22T10:06:00Z",
      "idle": false, "lastEventTimeMs": 1790071592000, "lastEventTimeIso": "2026-09-22T10:06:32Z",
      "alignmentGroup": null, "alignmentHeld": false, "driftFromGroupMinMs": 0,
      "idlenessTimeoutMs": 300000
    },
    "orders:1": {
      "watermarkMs": 1790071058000, "watermarkIso": "2026-09-22T09:57:38Z",
      "idle": true, "lastEventTimeMs": 1790071080000, "lastEventTimeIso": "2026-09-22T09:58:00Z",
      "alignmentGroup": null, "alignmentHeld": false, "driftFromGroupMinMs": 0,
      "idlenessTimeoutMs": 120000
    }
  }
}
Three steps. Find the partition whose watermarkMs — or previewWatermarkMs, where a partition shows one — equals globalMs: that is the minimum, the one every window is waiting for — here orders:0, because orders:1 is idle and excluded; its watermark is lower but no longer counts. Then read idle, lastEventTimeMs and idlenessTimeoutMs together: the timeout is the one in force for that partition — its source's withIdleness if set, otherwise the global key — and without it the other two are uninterpretable once timeouts differ per source. orders:1 went quiet at 09:58, its source asked for two minutes, so it idled out at 10:00 and the application moved on. Finally, a minimum partition that is not idle with a fresh lastEventTimeMs is delivering old timestamps — the lagging-but-live case part 2 introduced, which idleness deliberately does not touch.
The meters that matter
The watermark family sits under stoatflow.watermark.*, and the split between info and debug level is the first thing to know about it.
| Meter | Level | What it tells you |
|---|---|---|
stoatflow.watermark.current | info | the global watermark, epoch ms — the number every window is judged against |
stoatflow.watermark.lag.ms | info | wall clock minus the watermark; sampled ~1 Hz whether or not the watermark moved, -1 before the first one |
stoatflow.watermark.advance.total | info | how often the watermark moved |
stoatflow.dropped.records.total{reason="late_window"|"late_session"} | info | records dropped because their window had already closed — the real drop signal; reason="no_event_time" counts records skipped at the source because they carry no event time |
stoatflow.watermark.preview.partitions | info | partitions whose next record waits behind older records elsewhere and counts toward the watermark as if processed — a record stamped in the future, or a skewed catch-up |
stoatflow.watermark.alignment.partitions.held / .held.time.total / .yields.total {group} | info | partitions held for alignment, the time a hold stopped all dispatch (rate() is the fraction of time spent waiting), and in-order yields |
stoatflow.topology.event.time.tracking | info | 1 when the engine tracks watermarks, 0 when it decided this topology has no event time |
stoatflow.store.segments{store_name,store_type} | info | live RocksDB segments per window/session store — tracks watermark progress, not write volume |
stoatflow.watermark.partition.current{topic,partition} | debug | each partition's own watermark |
stoatflow.watermark.late.records.total{topic,partition} | debug | arrivals behind the watermark, most of which are still folded in |
stoatflow.watermark.out.of.orderness.max | debug | the spread between the most and least advanced partition watermarks — partition skew |
stoatflow.watermark.alignment.drift.ms / .group.min | debug | alignment drift and group minimum, only when alignment is configured |
Two traps. The first is the pair of "late" counters. dropped.records.total with a late_* reason is Kafka Streams' dropped-records parity and it is at info level; late.records.total counts arrivals behind the watermark, most of which land inside grace and are folded in, and it is at debug level — a default deployment does not have it. Alert on the first; turn the debug level on when you are tuning out-of-orderness, and let the second tell you how disordered the input really is.
The second trap is event.time.tracking. With timestamp-coordination-mode: AUTO, the default, the engine turns watermark tracking on only when the compiled topology needs it — a watermark-aware processor, an explicit WatermarkStrategy on a source, a STREAM_TIME scheduled source, or a processor declaring event-time timers. If you expected windows to close and this gauge reads 0, the topology is not what you think it is; force ENABLED and compare before looking anywhere else.
One alert on day one
The metrics page ships two rules; set at least the first before the application takes traffic.
# The watermark has not moved in five minutes while the app reports RUNNING (== 4)
delta(stoatflow_watermark_current[5m]) == 0 and stoatflow_client_state == 4

# Event time has fallen more than five minutes behind wall clock while RUNNING
stoatflow_watermark_lag_ms > 300000 and stoatflow_client_state == 4
Both are joined on stoatflow_client_state == 4, so a restoring or paused application does not page you. What they catch is the failure mode this series keeps returning to: a stalled watermark closes nothing. Windows stay open, suppress buffers grow, timers do not fire, stores stop expiring, and segmented stores add one RocksDB instance per segment interval on the partitions that are advancing. We measured it: a partition that keeps delivering records with old timestamps is never idle-excluded — deliberately, since excluding it would over-advance the watermark and drop its records as late — and in the measurement it pinned the watermark for thirty minutes of lag and grew a three-minute-retention store from its plateau of four segments to thirty. The count was back at four within one barrier of the partition catching up.
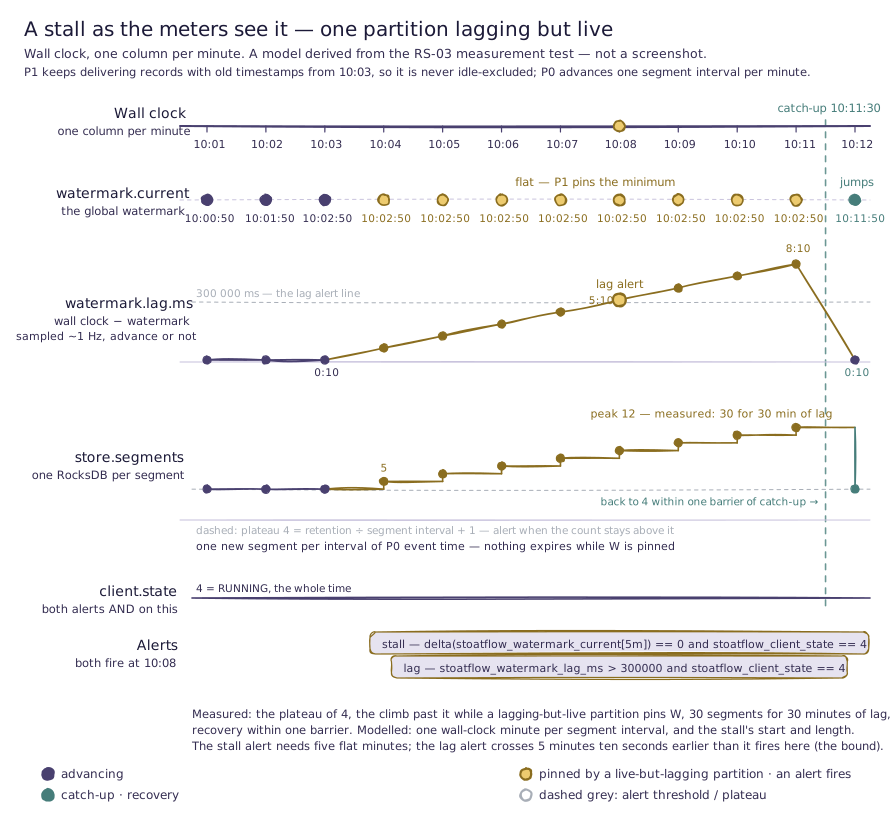
The diagram is a model of that measurement — minutes rather than the test's compressed 400 ms batches, an eight-minute stall rather than thirty — but its shape is the one you will see on a dashboard: watermark.current flat, lag.ms climbing a minute per minute until it crosses the 300 000 ms line, both alerts firing at the same minute because the stall alert needs five flat ones, and store.segments climbing past the dashed plateau with nothing in the count to say why — pair it with lag.ms, which does.
The runbook when either fires is /watermarks, then one of five branches. The minimum partition is idle-eligible but not yet idle — it went quiet and its timeout has not elapsed — so either wait, or lower that source's withIdleness. It is live but delivering old timestamps — idle: false, a fresh lastEventTimeMs, an old watermarkMs — which is the producer's clock or a replay, and no watermark setting fixes it: find the producer, or accept the stall for the duration of the catch-up. alignmentBinding is set: a watermark-alignment hold is stopping every source while a lagging member of its group has nothing buffered — stoatflow.watermark.alignment.held.time.total climbs, and a hold past a minute is logged with the sizing rule; size maxAllowedWatermarkDrift to at least that source's normal gap plus the difference in bounds, or give it a shorter withIdleness. A partition's next record is stamped in the future and waits behind older records: with a built-in strategy that is not a stall — within about a second event time is set by the other partitions, and /watermarks shows previewWatermarkMs and headHeldSinceMs — but with a custom WatermarkGenerator there is no preview, so the watermark stands still until the record is dispatched or the partition idles out; either way a warning names the partition once the record is more than a minute ahead of the wall clock, and the fix is the producer's clock or the timestamp unit (the full story). Or event.time.tracking reads 0 and there was never a watermark to stall. Part 2's noWatermarks() trap no longer reaches production for anything the watermark drives: the engine, and the driver, refuse that topology when it is built.
The three knobs
The engine-wide event-time configuration is three keys under stoatflow.watermark, plus one under processing; everything per source lives in code, on Consumed.
stoatflow:
  watermark:
    max-out-of-orderness-ms: 10000   # default strategy lag — size to measured skew
    idleness-timeout-ms: 300000      # 5 min; 0 disables idleness for sources without withIdleness
    auto-interval-ms: 200            # periodic emit cadence
  processing:
    timestamp-coordination-mode: AUTO  # AUTO | ENABLED | DISABLED
max-out-of-orderness-ms is the lag of the default strategy, and the number to size to the disorder the data actually has — late.records.total at debug level is the closer measure; out.of.orderness.max shows skew between partitions. idleness-timeout-ms is the fallback for sources that set no withIdleness of their own; zero switches idleness off for them, which pins a never-written partition forever, and the engine logs one warning at start-up naming the sources left uncovered. auto-interval-ms is the periodic recompute cadence, Flink's pipeline.auto-watermark-interval under another name, and rarely worth touching. timestamp-coordination-mode is a switch over the detection described above: AUTO derives it from the topology, ENABLED forces tracking on as a safety valve, DISABLED forces it off for benchmarking — and is refused, at start-up and by the driver, for a topology with anything the watermark drives.
Two things are deliberately not here. Alignment has no YAML keys — it is a property of a source, configured on Consumed. And a per-source WatermarkStrategy overrides both the assigner and the generator, whereas the Kafka Streams-shaped default.timestamp.extractor overrides only the event-time basis.
Restart, failover, migration
The watermark survives a restart in two parts. The floor every lane judges late records against — the watermark stamped on the last committed barriers — lives in a changelogged store, <application.id>-stoatflow-watermark-changelog, committed in the barrier's own transaction, and seeds every lane at start and at an HA promotion. Each source partition's partition time rides its committed offset, in Kafka Streams' own metadata format, and seeds the watermark tracker as the partition registers. So after a crash restart, an in-place restart or a promotion, /watermarks answers 503 or Long.MIN_VALUE for a moment and then resumes from the committed cut — it does not wait for new records. A crash restart resumes the floor one barrier back, a graceful one exactly where it stopped; either way a window closed before the restart stays closed, and a late record for it is dropped as it would have been. Offset tools cannot erase the floor; wiping the state takes it with it, and the engine then resumes from the partition times.
The rest survives with it. Event-time timers are persisted with the state: a timer armed before a shutdown — even one followed by a wiped state directory — is rebuilt from its changelog on restart and fires once the resumed watermark passes it, which is exactly what the timer-recovery test drives. On an HA promotion the standby reloads its timer heap from the replicated store, so a timer the old active already fired and committed does not fire again on the new one — the failover test pins that to exactly one firing. And the emit frontier is restored, so a window whose final result was already emitted is not emitted again; a window that was pending is emitted once, later.
The same applies at a Kafka Streams cutover. The migration tool translates a windowed changelog into StoatFlow's layout; with emitFrontier: true it also seeds the frontier from the store's own maximum timestamp, so the first watermark tick after cutover does not re-emit every restored closed window in one burst.
Tradeoffs and limits
Late arrivals are invisible at info level. A default deployment sees drops, not the disorder that causes them. Enable the debug level for the watermark family while tuning the bound, then turn it off.
Joined.withGracePeriod does nothing. It is stored and round-tripped so Kafka Streams code compiles and reads back what it wrote, but the effective grace of a stream-stream join comes from JoinWindows.ofTimeDifferenceAndGrace, and a stream-table join has no grace at all. Setting it on Joined produces no error and no effect.
DIRECT dispatch has no watermarks, and refuses event time. The processing-time fast path never advances the watermark. AUTO resolves an event-time topology to LANE; an explicit DIRECT with event time fails at start-up with a message that says so. A legitimately processing-time topology therefore shows event.time.tracking = 0 and a 503 from /watermarks — by design, not by fault.
Idleness cannot be tested in the driver. It is wall-clock based and the driver has no partitions to idle; test it on a broker, or accept a slow test.
The driver cannot show the frontier lag at all. Emission-timing assertions belong in an integration test; the driver is for what, not when.
Ingestion time is not supported. Event time comes from the record timestamp or an assigner — on a LogAppendTime topic that is the broker's append time — or you work in processing time; there is no Flink-style ingestion time stamped as the source reads.
What's coming next
Part 2 named a problem the engine does not solve today: a bulk reload stamped in the past starves the live side, because ordered dispatch — correctly — serves the oldest partition head first, each partition in offset order, and the watermark stands still until the reload has drained and its partition idled out. Alignment holds back the source that is ahead; this needs the inverse, a way to let the source that is behind defer. Dispatch tiers and deferred watermarks are designed and on the roadmap. When they ship, the post that follows will cover them alongside alignment in full — including why we built alignment for Flink parity and reframed its motivation after our own design review.
That closes the series. Three clocks set StoatFlow's watermark beside Kafka Streams' and Flink's clocks; Making the watermark move was the configuration discipline a minimum demands; Closing a window under exactly-once followed one advance to a committed result; this part is what you test and what you watch. The event-time concept page is the durable summary of all four.
Read on:
- Testing —
advanceWatermark,advanceWallClockTimeand the driver's time surface. - Metrics and the metrics reference — the curated set and the full catalogue.
- REST API reference — every
/watermarksfield. - Core configuration — the watermark keys.
- Changelog topics — the watermark changelog that carries the late-drop floor across a restart or a promotion.
- Why a stream processor must never reorder a partition — offset order, and the record stamped in the future.
- Migrating with data — the
emitFrontiercutover flag.
The self-join that emitted nothing
On Kafka Streams, s.join(s) over two records of one key emits four results. On StoatFlow it emitted none — no error, no log line, no metric. A stream–stream join chose which side a record belonged to by the name of the source it came from, and a self-join's records all come from one source. The same rule dropped records in chained joins, merged legs and cogroups. How we found every affected shape by running Kafka Streams' own test driver as the oracle, and how the fix makes the edge carry the input.
A use-after-free in a RocksDB iterator, and the test that passed on Linux
A StoatFlow state store layers each epoch's uncommitted writes over RocksDB in native write batches, and an iterator reads through all of them. Four defects let a batch be freed, or rewritten, under an iterator still reading it: segmentation faults, keys read twice, a value read back as garbage. None was reachable through a store StoatFlow builds. The interesting part is how we proved them — one JVM per scenario, the allocator scribbling freed memory — and why the first version of that test passed on Linux.