
Measuring StoatFlow failover: four scenarios, from the logs

The hot-standby post made a claim: failover in seconds, independent of state size. A claim like that earns the right to be measured. So I put a live active/passive pair under load and triggered every way a StoatFlow active can lose its role — and the first thing the test surfaced is that the obvious way to test failover does not test failover at all. kubectl delete pod is a graceful SIGTERM handoff, not a crash.
This is the measured failover story: four distinct scenarios, the millisecond timing taken from pod logs — because Prometheus cannot resolve a one-second event — and the things the numbers contradicted, including a single crash that recovers in place without ever failing over. Measured on StoatFlow 1.0.0-rc.4, an active/passive word-count pair on Kubernetes at ~1,000 input records/s (≈ 44K output records/s), exactly-once.
TL;DR
kubectl delete podis not a crash. Kubernetes sends SIGTERM first; the JVM shutdown hook drains and hands off gracefully. A real crash needs a SIGKILL of the JVM's host PID from the node.- Four scenarios, not one: graceful switch, SIGTERM/rolling deploy, JVM crash with in-place restart, and node loss with a standby takeover. They behave — and time — very differently.
- Graceful is sub-second and lossless: ~0.4–0.9 s of no-processing, the in-flight epoch committed before handover, zero reprocessing under exactly-once.
- A single JVM crash recovers in place (~3.6 s) and never fails over — the container restarts faster than the standby's detection window. The standby takes over only when the active is genuinely gone (~8.5 s, detection-dominated).
- That is the hard-crash tier specifically. A fatal the engine catches behaves differently again: a restartable one (a processing or production failure, with a
REPLACE_THREADhandler) is absorbed in place and never fails over either; anything else drains and hands off, so it does — see application faults.- Grafana shows the shape; logs show the timing. A 10-second scrape and a one-minute rate window cannot measure a one-second failover.
In this post
- The obvious test isn't a crash
- Four ways an active loses its role
- Expected versus measured
- What the numbers revealed
- Tradeoffs and limits
- Reproduce it
- What's coming next
The obvious test isn't a crash
The instinct, testing failover on Kubernetes, is kubectl delete pod. It feels like pulling the plug. It isn't. Kubernetes deletes a pod gracefully: it sends the container SIGTERM, waits out the termination grace period, and only then SIGKILLs. StoatFlow installs a JVM shutdown hook on SIGTERM, so a kubectl delete runs the graceful path — the active drains its in-flight epoch, commits it, publishes a DRAINING marker, and the standby promotes on that marker. The logs of the "crashed" pod give it away: Graceful shutdown completed in 21ms, then Stopped … in 99 ms. That is a clean handoff, not a crash.
To actually crash the process you have to SIGKILL the JVM — and not from inside the container. The JVM runs as PID 1 there, and the kernel protects a PID-namespace init process: an in-container kill -9 1 is silently dropped. The kill has to come from the node, against the JVM's host PID:
# on the node hosting the active pod
crictl inspect --output go-template --template '{{.info.pid}}' "$CONTAINER_ID"  # -> host PID
kill -9 "$HOST_PID"
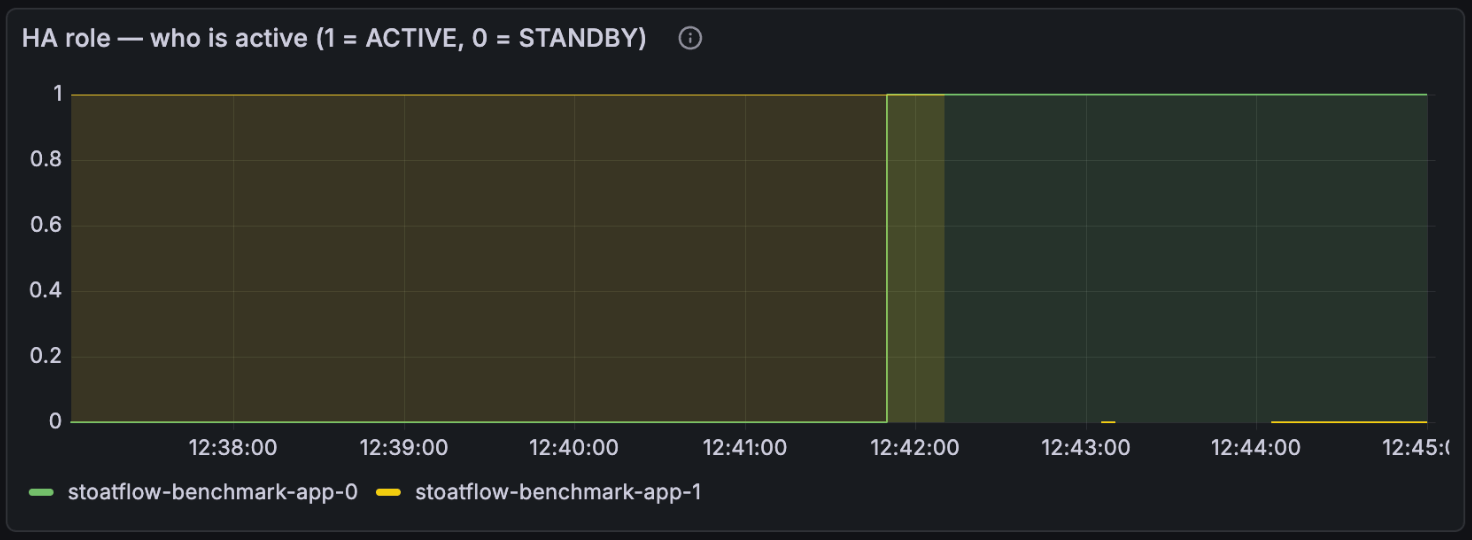
The second trap is measurement. The temptation is to read failover time off the Grafana dashboard. Don't. The benchmark ServiceMonitor scrapes every 10 seconds, so the stoatflow_ha_role gauge only flips at a 10-second boundary — a ±10-second quantisation on a one-second event. Throughput is a rate(…[1m]) that smooths a sub-second dip into nothing, and the end-to-end latency panel is a sticky high-water gauge that shows the blip's size but not when. Grafana is the right tool for the shape of a failover — the role line flipping, the brief throughput dip, the latency spike. For the numbers, the source of truth is the pod logs: millisecond timestamps on a single NTP-synced cluster clock.
Four ways an active loses its role
There are four, and conflating them is how you get a wrong number.
- Graceful switch — an operator
POST /ha/switch. The active drains, commits, drops the producer fence, and hands the role to the standby on theDRAININGsignal. - SIGTERM / pod-delete / rolling deploy — the same graceful handoff, but triggered by the JVM shutdown hook instead of an operator command. This is what
kubectl delete podand a rolling deploy do. - JVM crash, in-place restart — a true SIGKILL of the JVM. Kubernetes restarts the same container, so its node-local state is still there: the store delta-restores the aborted epoch rather than rebuilding from the changelog, and the pod re-promotes itself. A warm restart, not a cold start. The standby is never involved.
- Node loss, standby failover — the active is genuinely gone and cannot come back. The standby stops seeing its heartbeats and promotes itself via staleness detection.
Scenarios 1 and 2 are graceful: the active drops the fence deliberately and the standby promotes on an explicit signal. Scenarios 3 and 4 are ungraceful: the active dies without warning. The distinction between 3 and 4 is the one that surprised me, and it gets its own section below.
Expected versus measured
The design — ADR-125 — sets the expectations. Promotion is fence-and-assign in parallel, then resume against already-warm state, which the design measured at ~383 ms, independent of state size. Ungraceful failover adds a detection cost on top: the standby has to notice the active is gone before it can promote.
Here is what a live pair under load actually did, every figure taken from the logs.
| Scenario | Trigger | Detection | Promotion critical path | Stop-the-world | Reprocessing |
|---|---|---|---|---|---|
| Graceful switch | POST /ha/switch | immediate (DRAINING) | ~0.5–0.8 s | ~0.4–0.9 s | none |
| SIGTERM / rolling deploy | kubectl delete / rollout restart | immediate (DRAINING) | ~0.35–0.4 s | ~0.4 s | none |
| JVM crash, in-place | SIGKILL the JVM | — (same pod recovers) | n/a (warm restart, self-promotes) | ~3.6 s | one epoch |
| Node loss, failover | node gone | ~7 s (staleness) | ~0.8 s | ~8.5 s | one epoch |
Two definitions hold the table together. The promotion critical path is the work to bring a warm standby to serving once it has decided to promote — fence-and-assign, catch the last changelog records, start the engine threads. Measured at 350–820 ms across runs, it brackets the design's ~383 ms; the spread is the changelog catch-up and thread start under load. Stop-the-world is the window in which neither instance is processing — bounded by the old active stopping and the new active resuming. That is the number that matters for availability, and it is much smaller than it looks from the dashboard, for a reason worth its own paragraph below.
The graceful paths (switch, SIGTERM) confirm the design cleanly: sub-second, and the in-flight epoch is committed before the handover — Phase 2: Final barrier N committed successfully, then a clean Phase 4b: Commit thread stopped, in about 21 ms — so the new active resumes from a committed boundary with nothing to reprocess. The ungraceful node-loss path matches the design's other published figure: detection dominates, at roughly seven seconds, and promotion is the fast part.
What the numbers revealed
Three things the measurement contradicted or sharpened.
A single JVM crash recovers in place — it does not fail over. Kill the active's JVM and the standby does nothing. Kubernetes restarts the crashed container in ~1.4 s; StoatFlow restores its node-local state — a warm restart that delta-restores only the aborted epoch's records, not a rebuild from the changelog — and re-promotes itself in ~2.2 s, back to serving in ~3.6 s total. That is well inside the standby's ~7-second detection window, so by the time the standby could have concluded the active was gone, the active is already back. The warm spare earns its keep on node loss, not on a process crash that the orchestrator can paper over faster than the failure detector can fire. The cost is one reprocessed epoch — the in-flight transaction was aborted, never committed, never visible to read_committed consumers — not a duplicate, not a loss.
Read "crash" literally, though: this is a SIGKILL, where the JVM dies without running anything. A fatal the engine catches takes a different path, and which one depends on whether a rebuilt engine could survive it. A restartable fault — a processing or production failure, with a REPLACE_THREAD handler registered — is absorbed in place: the engine is rebuilt inside the live JVM and the pod keeps the active role, so there is no failover at all until the restart budget is spent. Anything else drains, publishes DRAINING on its way out, and the standby promotes off that signal via the same fast path as a graceful switch — for that case the table's graceful rows are the ones to read, not this one.
There is a sharp edge here: this is the first-crash figure. A pod that keeps crashing trips Kubernetes' CrashLoopBackOff, an exponential restart delay that grows to tens of seconds. The StoatFlow recovery stays ~2 s; the rest is the kubelet holding the container down. If you benchmark crash recovery, reset the restart count first — or you are measuring the kubelet's patience, not the engine's.
Stop-the-world is not the latency blip. The dashboard's end-to-end latency spikes to ~2 s on a graceful switch; the measured stop-the-world is ~0.9 s. Both are correct — they measure different things. Stop-the-world is the control-plane gap: no engine running. The latency blip is longer because, the moment processing resumes, the new active has to drain the input that piled up during the gap — at 44K records/s, even a sub-second pause leaves a backlog to chew through. The felt recovery is stop-the-world plus the catch-up; the availability gap is stop-the-world alone. Reporting one as the other overstates the outage by 2–3×. The blip is largest on a node-loss failover, where the gap itself is seconds — the panel below catches one: p95 and p99 climb to ~8 s while the standby takes over, then snap back.
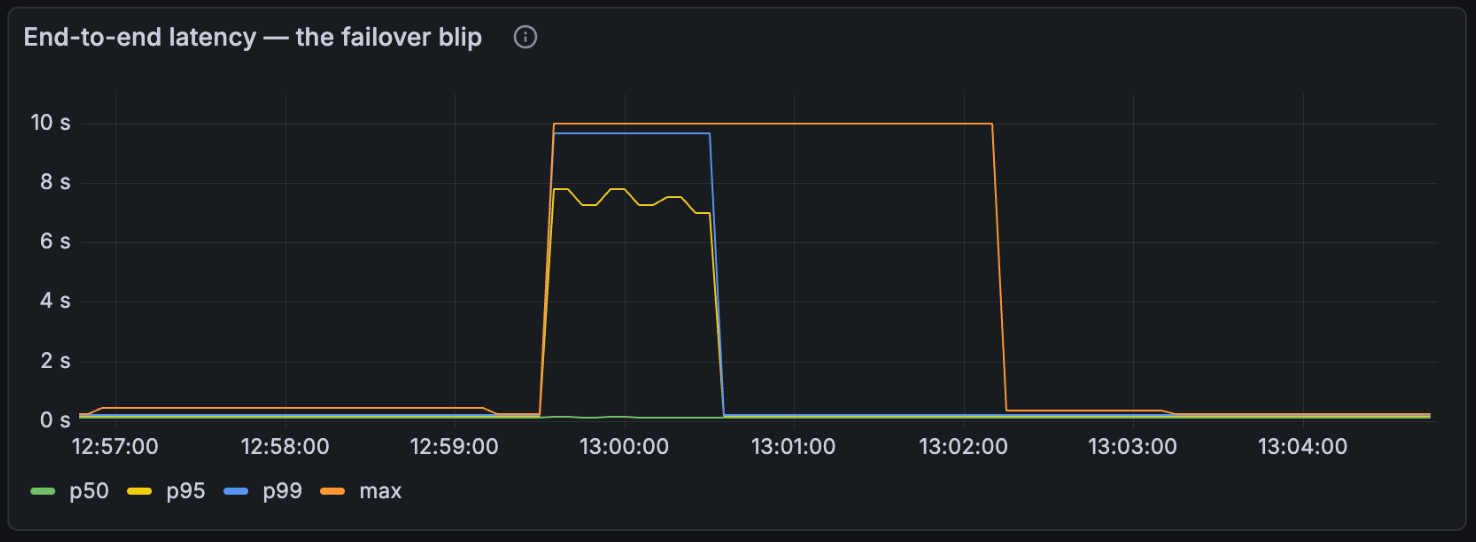
Detection is the whole cost of an ungraceful failover. A clean node-loss measurement — the active cordoned off, SIGKILLed, and force-deleted so it cannot restart — promotes the standby in ~8.5 s of stop-the-world. Of that, ~7 s is detection (staleness-threshold-ms plus the missed-heartbeat debounce) and only ~0.8 s is the promotion itself. If your recovery-time objective is tight, the lever is the staleness window, not the promotion path — the promotion is already as fast as a warm standby allows.
Tradeoffs and limits
- Ungraceful failover is detection-dominated. The ~7-second window is a deliberate default that trades failover speed for tolerance of transient network jitter. Tightening it speeds up node-loss failover and raises the risk of a spurious promotion on a blip. It is a knob; set it against your recovery-time objective, not by instinct.
- A process crash is not a failover. In-place restart (~3.6 s) is the common case for a crash, and it is faster than the standby would be. The standby is insurance against losing the node, not against the JVM dying.
- Honest crash testing needs node access. You cannot crash a StoatFlow active faithfully with
kubectlalone — a real SIGKILL comes from the node. If your test harness can only reach the API server, it is testing the graceful path and calling it a crash. - Two is the supported topology. The pair is one active and one standby. Scaling to three and back leaves a stale peer record in the coordination topic that pushes the survivor onto an unsupported multi-standby code path, where it can decline to promote. Clean it up by recreating the coordination topic, and stay at two.
- Exactly-once holds across every path. Graceful commits the in-flight epoch; crash aborts it and reprocesses one epoch. Either way the broker-enforced transactional fence guarantees at most one instance ever commits — no duplicates, no lost committed work, for
read_committedconsumers.
Reproduce it
The four scenarios are automated in a single drill that prints the log-based timing — promotion critical path and stop-the-world — rather than the inflated wall-clock:
ha-failover-drill.sh --mode switch     # graceful handoff
ha-failover-drill.sh --mode sigterm    # SIGTERM / pod-delete (graceful, not a crash)
ha-failover-drill.sh --mode crash      # true SIGKILL of the JVM -> in-place restart
ha-failover-drill.sh --mode nodeloss   # cordon + SIGKILL + force-delete -> standby failover
The crash and nodeloss modes SIGKILL the JVM's host PID from the node over SSH, resolve timing from the logs, and — for node loss — cordon the node so the pod genuinely cannot come back, then un-cordon afterwards. The full walkthrough, including the dashboard to watch and the gotchas, is in the playground runbook in the repository.
What's coming next
Update (2026-07-02): this shipped. The in-place engine restart is no longer exploratory, and the round-trip described below is no longer always a process restart — an active that loses its role can now rebuild its engine inside the live JVM. The same work lifted the two-standby constraint. See In-place engine restart: the primitive behind multi-standby HA. The section is kept as written for the record.
Across all four scenarios, one round-trip recurs: an active that loses its role exits the process and lets Kubernetes restart it. A graceful demote self-terminates and comes back as a fresh pod; a crash is a container restart; even an in-place recovery is the orchestrator rebuilding the whole container. The engine teardown and re-initialisation happen, but always wrapped in a process restart.
The work in progress — an in-place engine restart — removes that wrapper. The idea is to tear down and rebuild the processing engine in the same process, without exiting the JVM or recreating the application instance, and resume from the last committed transactional offsets: an in-process crash recovery, exactly-once intact via the same transactional.id epoch-bump fence that protects a cross-pod handoff today. It is the shared primitive behind three otherwise-separate needs — the faithful analogue of Kafka Streams' REPLACE_THREAD (which StoatFlow currently degrades to a full application shutdown), the hot-standby promotion path, and dynamic lane re-tuning. Build it once, cleanly, and all three get faster.
It is exploratory — a draft on the roadmap, pending a feasibility spike and an ownership decision, not a committed release. But it is the natural next step the measurements point at: the promotion path is already fast; the remaining cost on a crash is the process round-trip, and that is the round-trip this would remove.
For the shipped behaviour, the High availability guide has the configuration reference and the operator endpoints. The full measurement data — every raw timestamp, the stop-the-world boundaries, and the corrections this testing forced — lives in the repository's failover-timing report. The model holds: one active, a warm passive spare, the fence as the backstop, and now numbers behind the word "seconds".
How we obfuscate StoatFlow — and what the public-API boundary taught us
A drop-in Kafka Streams DSL has to stay byte-stable while the engine beneath it stays hidden. Those two goals pull apart — and every interesting bug we hit while obfuscating StoatFlow lived on the seam between them.
Hot standby for StoatFlow: failover in seconds, not a cold restore
StoatFlow recovery has always been fast restart — but restart time scales with state. Hot standby is an opt-in active/passive pair that fails over in seconds regardless of state size, with exactly-once preserved across the handoff. Redundancy, not scale-out.