
Cutting CI from 50 minutes to 16: choosing a runner platform

StoatFlow's CI took 50m30s on a green cache-miss run, and the p90 a developer actually waits on had climbed from 33 to 54 minutes in three months — the wait, more than the growing bill, forced the exercise. CI now takes 15m40s, and costs less. In between we built a complete self-hosted runner fleet on Hetzner, validated it, and did not use it; and nearly a quarter of the final improvement came from deleting four lines of YAML.
TL;DR
- Memory, not CPU. Each integration-test fork needs ~3–3.5 GB for its Kafka container; GitHub's 7 GB runner fits one, so a knob worth 2.45× locally did nothing in CI. (Six weeks on, measured on the runner: roughly half a gigabyte per fork on top of a fixed base — see the second postscript.)
- We built self-hosted first, then benchmarked the managed option — the expensive order. Hetzner worked (27m24s, ~€8.85/month) and still lost to Blacksmith, which tied the critical job with half the cores, for one line of YAML.
- The second-biggest win was free: removing a needless
needs: buildgate saved 8m08s — more than the entire difference between the two platforms. The catch, on 26 August: the Blacksmith rate was inferred and n=2. Four weeks on (postscript): the speed held across 70 runs and the invoice was $0 — but the free-allowance split broke in eighteen days.- Six weeks on (second postscript): the suite grew to 141 integration-test classes and CI back to 37 minutes. The runner's own metrics showed the job was neither RAM- nor CPU-bound but waiting, with Gradle's fork scheduling leaving forks idle for the last third of the run. Doubling the runner, doubling the forks and balancing the test classes across them took CI to 10m52s.
The problem: RAM, not CPU
StoatFlow's suite is dominated by tests that need a real broker — ~90 integration-test files, each starting its own Kafka container via Testcontainers, across nine CI jobs. Six months took the build from 29 Gradle modules to 47 and integration tests up tenfold; CI p90 followed, 33m25s in June to 53m40s in August.
The obvious fix — more cores — was wrong here. :core:integrationTest runs parallel forks; each needs roughly 3–3.5 GB. Locally, three forks took the suite from 31m39s to 12m56s — 2.45×. In CI the knob was inert: 7 GB fits exactly one fork. The constraint was memory, and GitHub sells memory in a bundle with cores.
The options, and the one we built first
GitHub's own larger runners fail on that arithmetic. The tier that fits three forks is the 4-core / 16 GB runner at 2× the standard rate ($0.012 against $0.006), and larger runners include zero free minutes at any size — so it must be twice as fast to break even and it forfeits the free allowance entirely. The 8-core tier a CPU-first instinct reaches for is 3.67×, and our measured scaling on the CPU-bound half of the suite was 1.38×. From the crowded field of drop-in runner providers we shortlisted self-hosted on Hetzner (a CX43: 8 vCPU / 16 GB, €15.99/month) and Blacksmith.
TestFlows GitHub Hetzner Runners provisions one VM per queued job, recycles them inside Hetzner's per-started-hour billing, and keeps the Gradle caches on persistent volumes; around it, OpenTofu, an Ansible role and three runbooks. It worked — four full CI runs green, 27m24s, about €8.85/month. Then we benchmarked Blacksmith, and it lost.
How to benchmark CI without fooling yourself
The transferable part, and where we nearly published a wrong number three times.
integration-test has three modes, and only one of them is the machine. A green run executes the suite in about 33 minutes. A cache hit never executes it and returns in under four. A red run takes about 48 minutes, because failing tests run to their timeouts and retries. A median across all of them describes none of them, so every hosted figure here is the green cache-miss population — n=17, the fortnight before the switch. Both candidates were measured cold, with Actions caching disabled: an unchanged tree otherwise returns a four-minute cache hit that measures nothing about the machine.
The three corrections. First, the all-runs median above, which we caught before publishing. Second: disabling the cache does not remove the fast path, it relocates it — on Hetzner, with the Gradle build cache on a persistent volume, a second run of the same tree returned integration-test in one minute. Third, the same trap from the other side: the baseline we first computed was 63m41s, a median over a window in which half the cache-miss runs were the red runs of one evening. The platform rows were all green, so that comparison flattered the switch by a quarter. A benchmark that does not control for cache state — or for run outcome — is measuring the cache, or the failure, not the machine.
The result
The chart is the whole story on one axis: the end-to-end wall clock of a green cache-miss run, first job start to last job finish, for the four configurations we measured.
StoatFlow `ci.yml`, 9 jobs, green cache-miss runs. Measured 2026-08-24 to 2026-08-26. Caching disabled on both candidate platforms so the comparison comes down to the hardware.
GitHub-hosted 2 vCPU / 7 GB
wall clock: 50m30s
Median of the green cache-miss population, n=17, 12–25 Aug. Where we started.
Hetzner CX43 8 vCPU / 16 GB
wall clock: 27m24s
Self-hosted, one VM per job. Built, deployed, validated — and not kept.
Blacksmith 4 vCPU / 16 GB
wall clock: 23m48s
Same job graph, half the cores of the Hetzner box.
Blacksmith + parallel graph 4 vCPU / 16 GB
wall clock: 15m40s
Identical hardware. The only change is four deleted `needs: build` lines.
Bar length is end-to-end wall clock on a linear axis, so lengths are directly comparable. Every row is a cache-miss run — the job that dominates this workload takes 45m34s when it runs the suite and 3m54s when Gradle restores its task outputs, so mixing the two populations would measure the cache rather than the machine. The last two rows share a platform and differ only in the job graph. One workload, one week, small n: an indication, not a settled result.
Per job, all green cache-miss:
| GitHub-hosted (2 vCPU / 7 GB) | Hetzner CX43 (8 vCPU / 16 GB) | Blacksmith (4 vCPU / 16 GB) | |
|---|---|---|---|
build | 18m18s | 9m13s | 7m33s |
integration-test | 32m45s | 14m36s | 15m50s |
native-image | 10m15s | 3m03s (warm cache) | 5m21s (cold) |
| Wall clock | 50m30s | 27m24s | 23m48s |
The deciding line is integration-test: 15m50s against 14m36s — a tie inside the ±20% variance band, with half the cores. That confirms the diagnosis: the job is RAM- and wait-bound, and Hetzner's eight vCPUs were mostly waiting on Kafka containers. On build, where clock speed does matter, Blacksmith won by 18%. It also mirrors the ubuntu-latest toolset (nothing missing), and caching is theirs to solve — Hetzner's cache volume and monitoring would have been ours.
Cost, and the trap in "cheaper per minute"
Blacksmith is cheaper than GitHub per minute — less useful than it sounds, because inside a free allowance the comparison is against zero. Our org is on GitHub Free: 2,000 Actions minutes a month (3,000 is Pro/Team). So we moved exactly three jobs — build, integration-test, native-image — and left six on hosted runners: 1,514 hosted minutes at 100 runs/month — 76% of the allowance, $0 of overage — with headroom to ~130 runs. (The postscript records how that split held up. It did not.)
Fewer moved jobs tips into overage; more spends money to save nothing. The move is one runner label plus one load-bearing flag: --max-workers=3 — Gradle test forks take worker leases; lower silently serialises the forks, higher admits a fourth Kafka container.
Above the allowance the picture inverts: a paid GitHub minute is $0.006, a Blacksmith minute ~$0.008 — but on the benchmark the moved jobs run 2.1× faster**, an effective **$0.004 per GitHub-equivalent minute. Fill the free allowance first, then move everything else.
The eight minutes that were free
Four jobs declared needs: build. None needed it — each does its own checkout and Gradle invocation, sharing nothing with build but an Actions cache they would hit anyway; the gate bought pure serialisation. Removing it changed the critical path from build + integration-test to max(all jobs): 23m48s → 15m40s — eight minutes from deleting four lines, more than the entire difference between the two platforms we spent days evaluating.
The trade: a failing build no longer skips those jobs, ~35 runner-minutes per red run — and build almost never fails. Audit the job graph before you buy hardware.
Tradeoffs and limits
We gave up the trust boundary — the one axis self-hosting genuinely won. CI holds ProGuard deobfuscation mappings and a licence key ADR-116 calls a master bypass key; Blacksmith is one more third party executing it. GitHub already sees everything, but this is the first thing we would revisit if the threat model changed.
The cost model rests on an inferred number. Blacksmith publishes $0.004/min for 2 vCPU, nothing for larger tiers; ours is that doubled, and whether free minutes apply there is unresolved — together, $0 versus ~$15/month. The first invoice settles it (and did — see the postscript).
n is small, and it is one workload. Two Blacksmith runs (15m50s, 15m34s) against a plan of five per side, on a JVM build with container-heavy integration tests — a CPU-bound suite would rank these platforms differently, and might have been fine on a larger runner all along. (The postscript has n=70.)
Building before benchmarking cost the most time. Six defects surfaced only by running the fleet — one an SSH default-identity mistake that created and billed a VM whose runner never registered. That is the cost of owning the option, invisible until you pick it.
What we chose
We are trialling Blacksmith with the split above and a fully parallel job graph. On watch: the first invoice, and hosted-minute consumption against the 2,000 ceiling. The Hetzner design is kept — torn down, but the right approach if the trust boundary ever becomes firm, and now measured rather than sketched.
Four weeks on (19 September)
Postscript. Everything above was written on 26 August. This section is the watch, four weeks in: every ci.yml run since the switch — 99 to 12 September, 17 more after a second routing change on the 13th — with per-job timings from the Actions API and the org's billing usage API. Green cache-miss runs only, so the columns compare with the table above.
| Hosted, 12–25 Aug (n=17) | Blacksmith, 26 Aug–12 Sep (n=70) | After 13 Sep (n=8) | |
|---|---|---|---|
| Wall clock, median | 50m30s | 15m06s | 18m10s |
| Wall clock, p90 | 56m36s | 20m46s | 23m05s |
build | 18m18s | 4m30s | 3m54s |
integration-test | 32m45s | 14m41s | 18m02s |
native-image | 10m15s | 3m22s | 3m08s |
The speed held. The two-run benchmark predicted the median within half a minute, and the p90 fell from 57 minutes to 21. build and native-image came in under their cold benchmark figures because the Actions cache is on in steady state; integration-test did not, because nothing caches a Kafka container. Runner pickup on Blacksmith was a median of 13 s and a p90 of 26 s, with three outliers — one a 3.4-hour wait during a dependabot burst on 31 August. All twelve failed jobs since the switch failed inside the test step; none in setup, checkout or Docker.
The invoice was $0. Blacksmith's 3,000 free minutes do apply at the 4-vCPU tier, so the inferred rate never mattered; usage ran at roughly 3,400 job-minutes a month.
The free-allowance split did not hold. Both inputs to the cost model moved, in the same direction:
| Assumed on 26 August | Observed, 26 Aug–12 Sep | |
|---|---|---|
| Runs per month | 100 | 99 in 18 days — ~165 |
| Cache-miss share | 43% | 89% |
| Hosted minutes per month | 1,514 | 2,108 in 18 days |
The 2,000-minute allowance ran out on 13 September. The overage is $1.63, so the money is trivial; the projection was wrong by more than double. The hosted lanes were also the long pole in five of the eight slowest runs, queuing 14–24 minutes for a hosted runner during bursts.
The fix inverted the rule above. On 13 September the two remaining testcontainer lanes moved to Blacksmith too — six jobs there now, three on hosted runners. It was not a like-for-like transfer of minutes: Blacksmith keeps a Docker image cache across jobs, so the Kafka image is already resident where ubuntu-latest pulls it every run. Measured on the same commit back to back, one of those lanes' :core:integrationTest task went from 67 s to 13 s and its total Gradle time from 5m13s to 1m47s. The move removed ~2,600 hosted minutes a month and added ~1,270 on Blacksmith. "More spends money to save nothing" was true only while the moved jobs were ordinary; testcontainer-heavy lanes should go first.
The suite is growing again, and it is the whole critical path. Integration-test classes went from 90 to 104 in three weeks; integration-test from 11–15 minutes in late August to 18–20 by mid-September, finishing last in nearly every run. The diagnosis at the top still holds: the next lever is RAM — the 32 GB tier with six forks — not cores.
If you do this yourself: measure your job graph before you buy hardware; make sure your before and after are doing the same work — we got that wrong three times before the numbers held still; and re-measure the budget after two weeks. Ours had both inputs move.
Six weeks on (10 October)
Second postscript. The first postscript ended on a prescription: the next lever is RAM, the 32 GB tier with six forks. We applied it, and the runner's metrics then showed that the diagnosis this post is built on was wrong.
The suite kept growing. Integration-test classes, counted the same way at each date: 99 on 26 August, 118 on 19 September, 141 now. The core integration task executes ~635 tests a run, and their class durations add up to ~94 minutes of serial time. On the 4 vCPU / 16 GB runner with three forks, integration-test took 37m15s on 10 October, near its 45-minute timeout, and set the wall clock of every run.
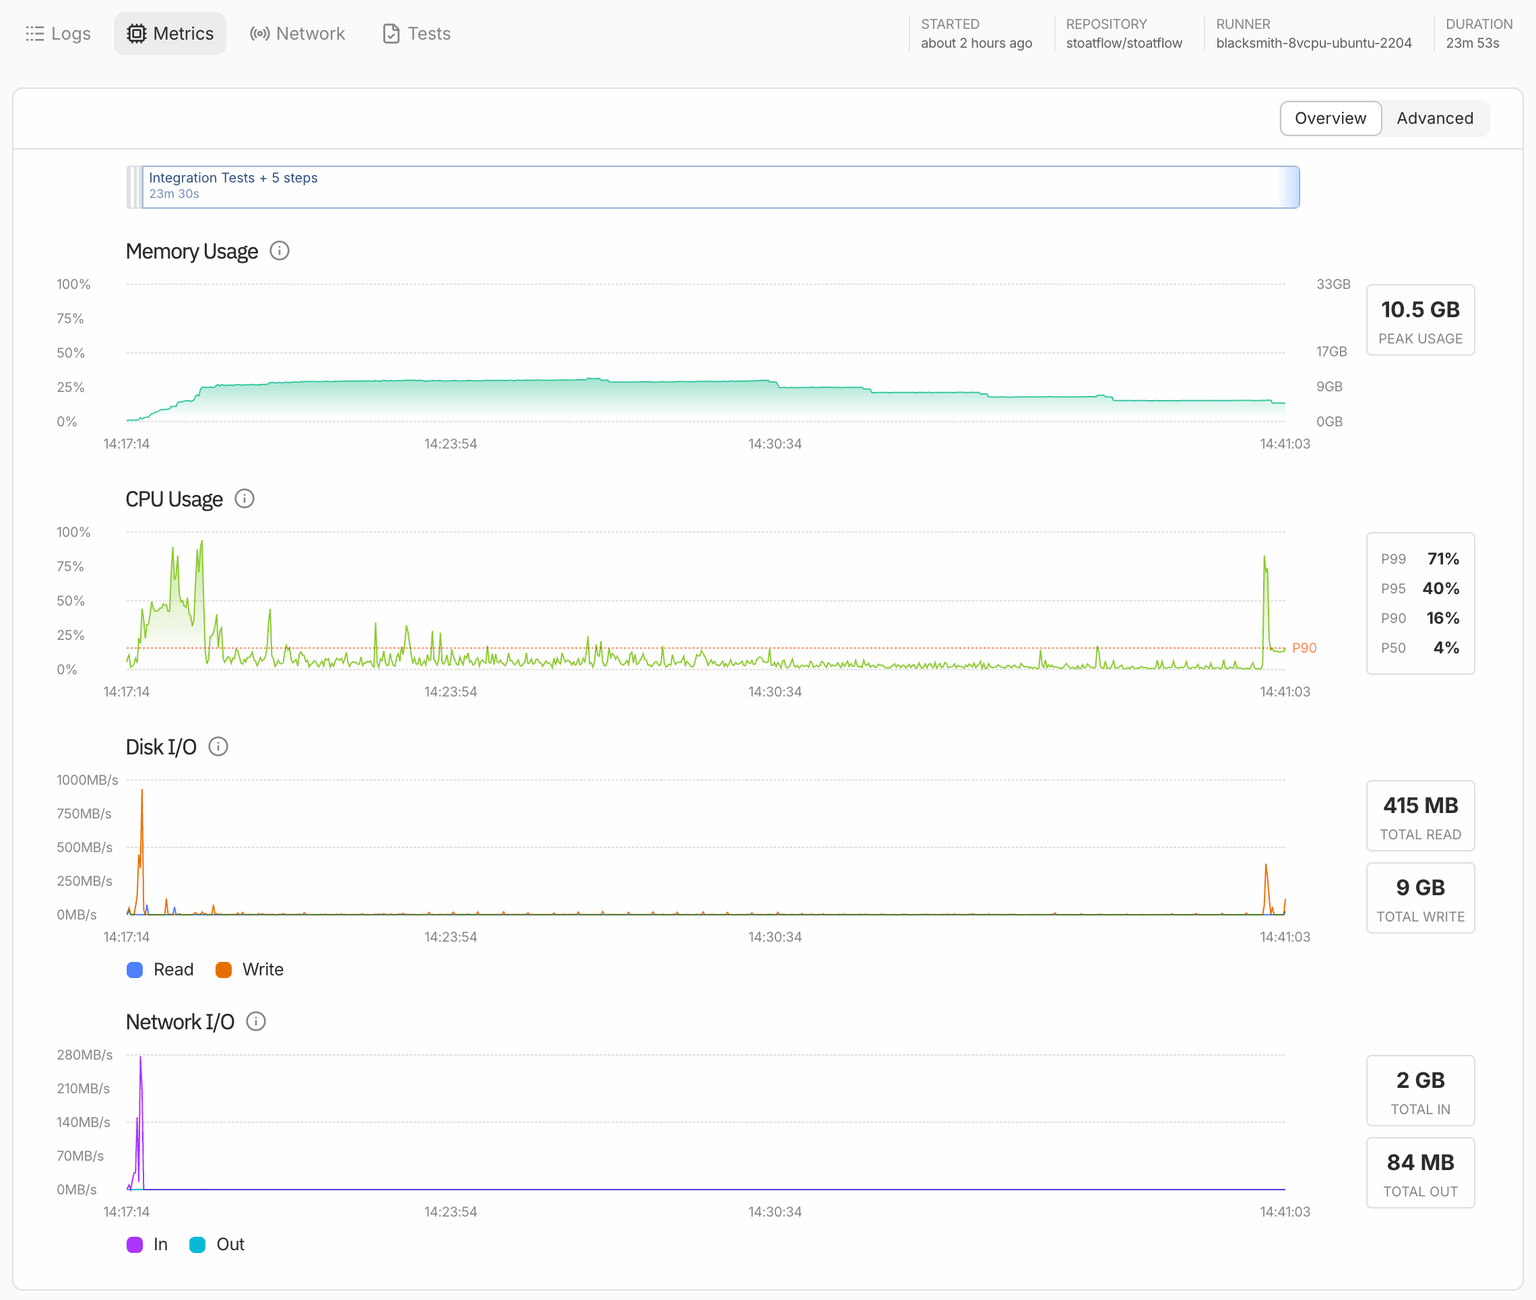
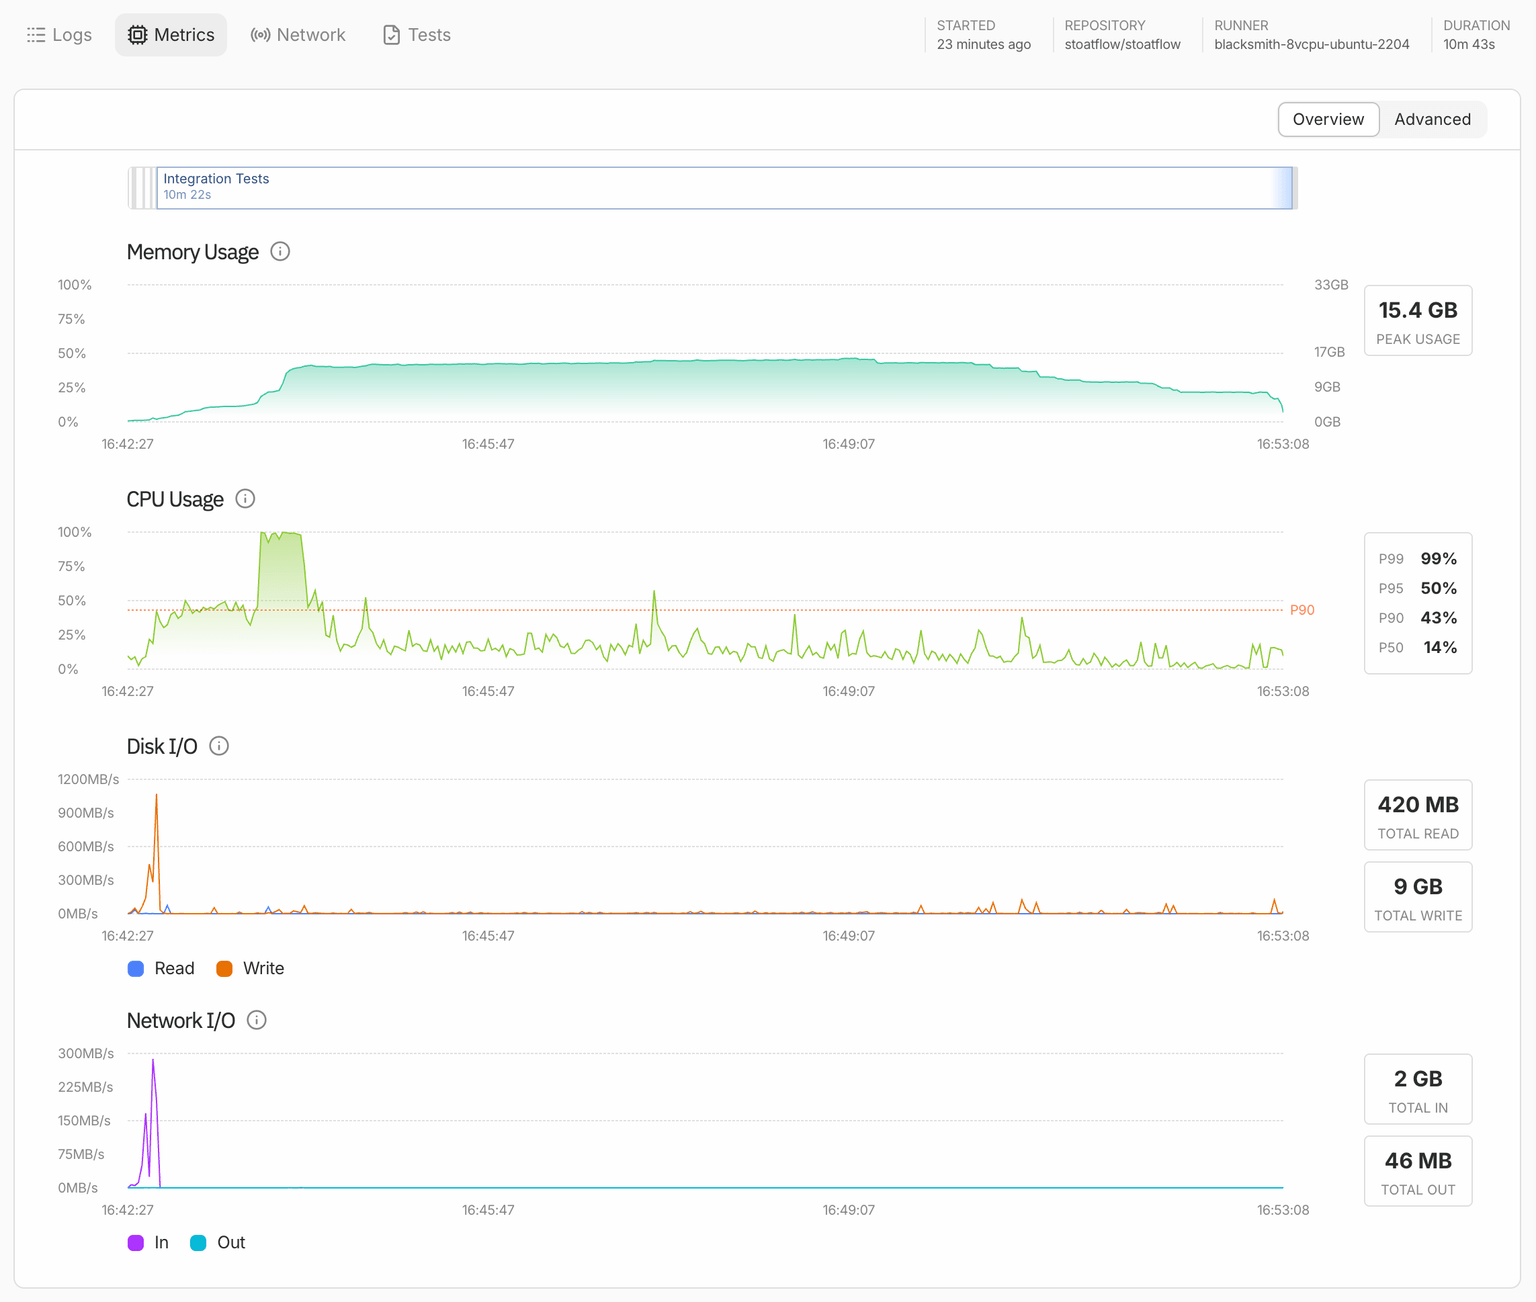
Doubling the runner worked, but not for the reason we gave. On 8 vCPU / 32 GB with six forks the job took 23m53s. Blacksmith records memory, CPU, disk and network for every job, and we had never looked. The three-fork run on the 16 GB runner peaked at 9.3 GB, the six-fork run at 10.5 GB of 32, and a later run with fourteen test JVMs at 15.4 GB. Most of that is fixed cost (the Gradle and Kotlin daemons, Docker); each extra test JVM with its Kafka container adds roughly half a gigabyte, not the 3–3.5 GB this post opens with. CPU told the same story: a median of 5% at three forks and 4% at six. The suite is bound neither by memory nor by cores. It is bound by waiting: barrier intervals, awaitState timeouts, poll budgets. Twelve forks on the same runner took the job to 16m40s, and the per-class durations did not move (89.6 against 91.9 minutes in total), so the extra forks contended for nothing.
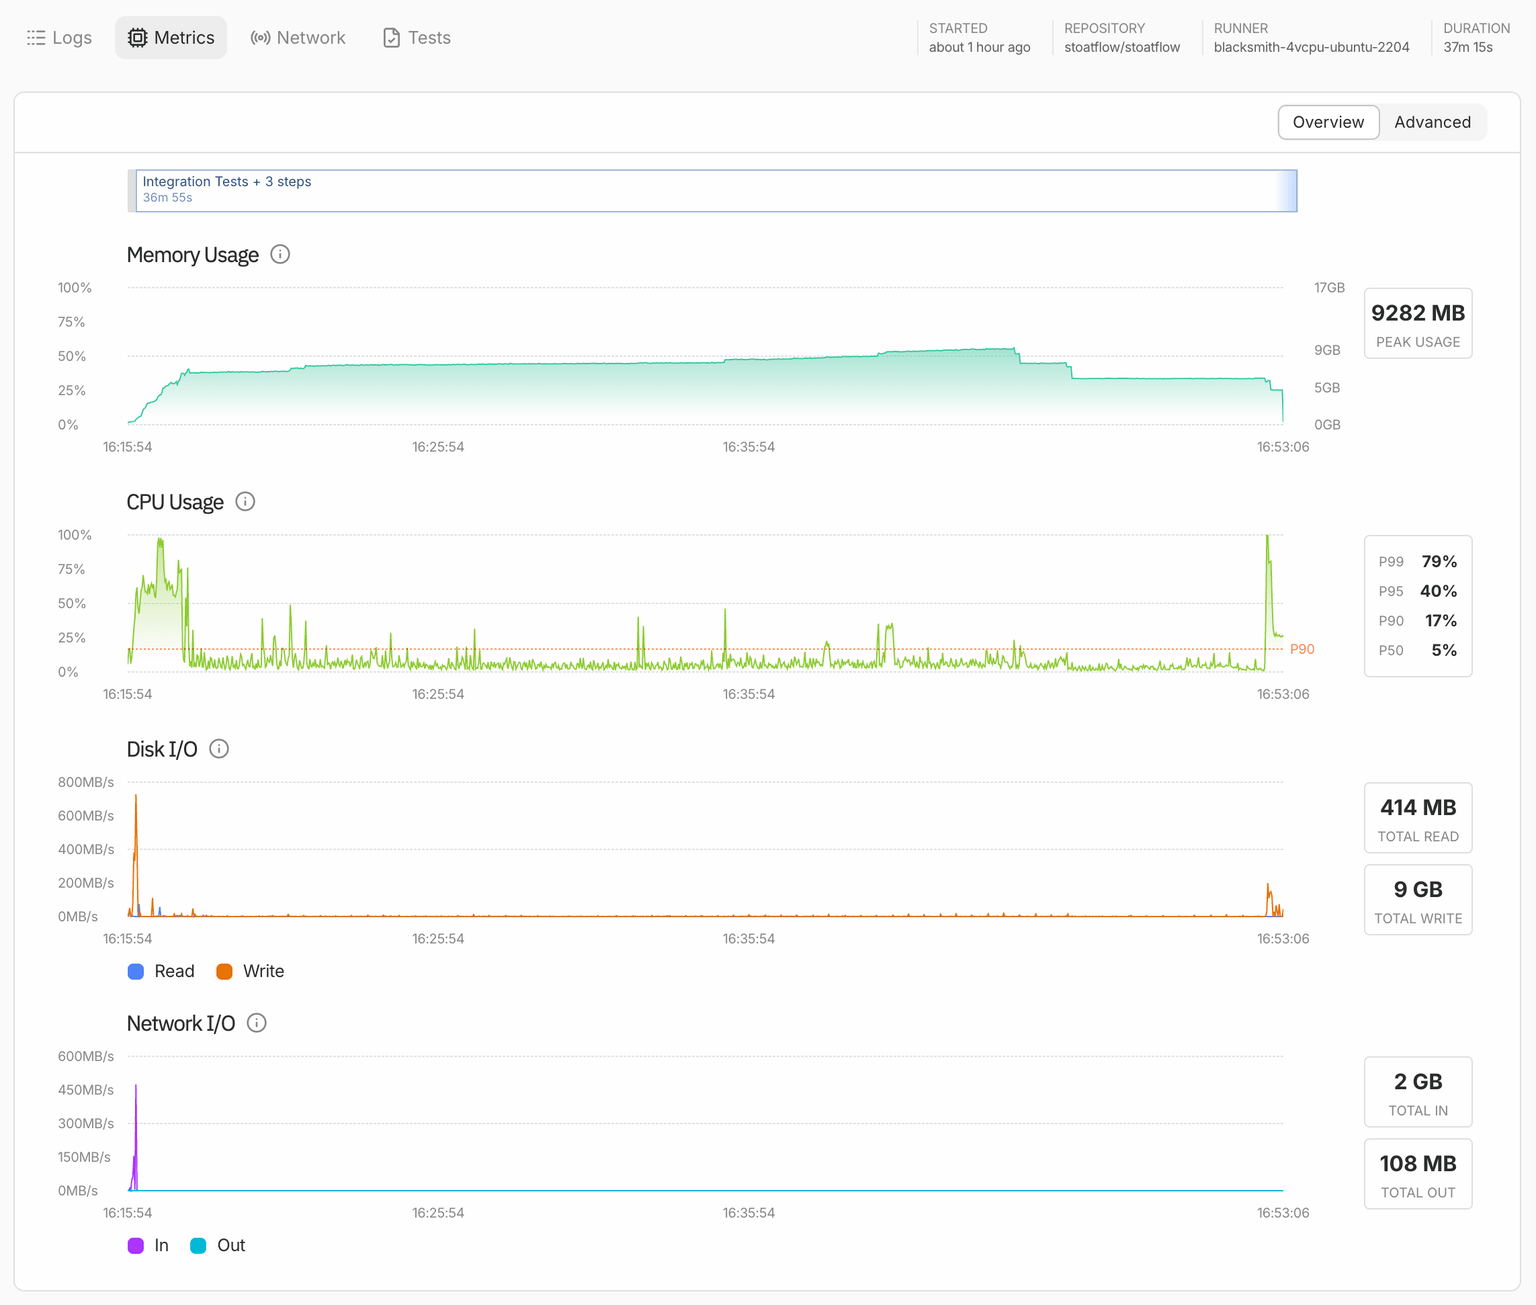
That leaves the first claim of this post unexplained: at that rate a 7 GB runner should fit several forks, and the fork knob was measured to do nothing there. We have not gone back to find out why. The fix that followed from the wrong diagnosis worked anyway, which is how wrong diagnoses survive.
The last third was scheduling. The memory graph of the six-fork run stepped down from minute 13 onwards: forks ran out of work and exited, and for the last six to ten minutes one or two forks ran alone. Gradle deals test classes to forks round-robin when the task starts. It has no queue for an idle fork to pull from, and our durations are heavy-tailed: one class takes 6.7 minutes, most take under one. At twelve forks the ideal was ~8 minutes; the task took 14.6.
So we stopped asking Gradle to balance. :core:integrationTestGroups runs the suite as twelve groups plus a catch-all, one single-fork task each, from a checked-in file. The groups follow functional areas (HA, recovery, EOS and commit, state and interactive queries, joins, windowing, topology), and the three largest areas are split by measured duration, so each group lands between 5.5 and 9.3 minutes. A new test class runs in the catch-all until someone files it under its area, and a balance report in the job summary flags lopsided groups. One flag is load-bearing: Gradle runs the tasks of a single project in parallel only with the configuration cache on, so without --configuration-cache the twelve groups run one after another.
| 4 vCPU, 3 forks | 8 vCPU, 6 forks | 8 vCPU, 12 forks | 8 vCPU, 13 groups | |
|---|---|---|---|---|
integration-test | 37m15s | 23m53s | 16m40s–18m16s | 10m43s |
| Slowest other job | 11m04s | 11m13s | 6m53s | 6m36s |
| CI wall clock | 37m25s | 24m22s | 16m50s–18m26s | 10m52s |
The grouped run is also the first that uses the machine. CPU sits at a median of 14% and a p90 of 43%, three times the forked runs; memory peaks at 15.4 GB, half the runner; and the end of the run tapers over two minutes instead of stepping down for ten.
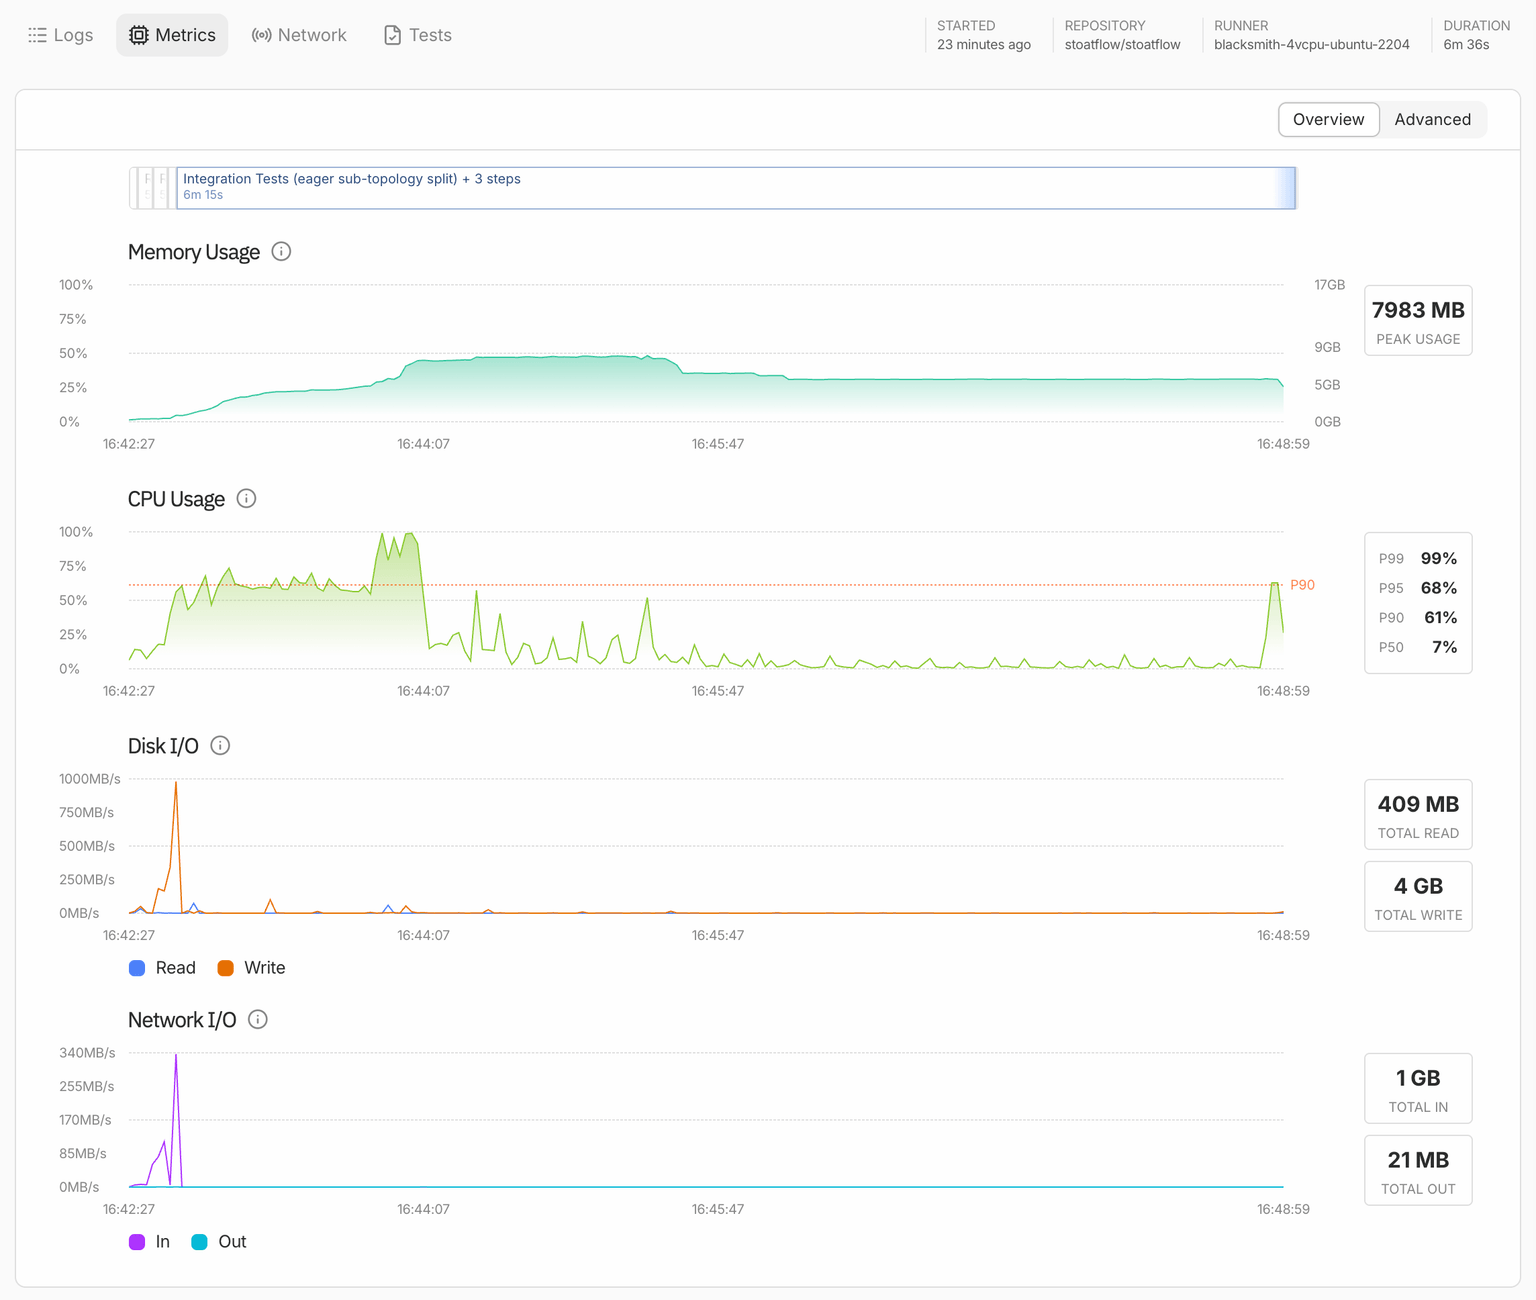
The two single-fork matrix lanes got the same treatment on their existing runners: the eager-split lane went from 11m04s to 6m36s with four forks, the processor-API lane from 4m15s to 3m00s with three. With a single fork the eager-split lane had peaked at 6.1 GB of 16 with a CPU median of 2%; with four it peaks at 8.0 GB, still half the runner. Not every job fits the pattern. build ran at a CPU median of 99% on the same runner tier, genuinely CPU-bound, and we left it alone because it is not on the critical path.
The $0 invoice did not last either. The first postscript reported a free month. September was not: Blacksmith billed $56.09 for 7,011 runner minutes across 1,142 jobs, the 3,000 free minutes were used up, and daily spend climbed from a dollar or two to $6–8 in the last week of the month. Blacksmith's own note on the free tier explains part of it: free minutes are counted in 2 vCPU minutes, so larger runners use them up faster.
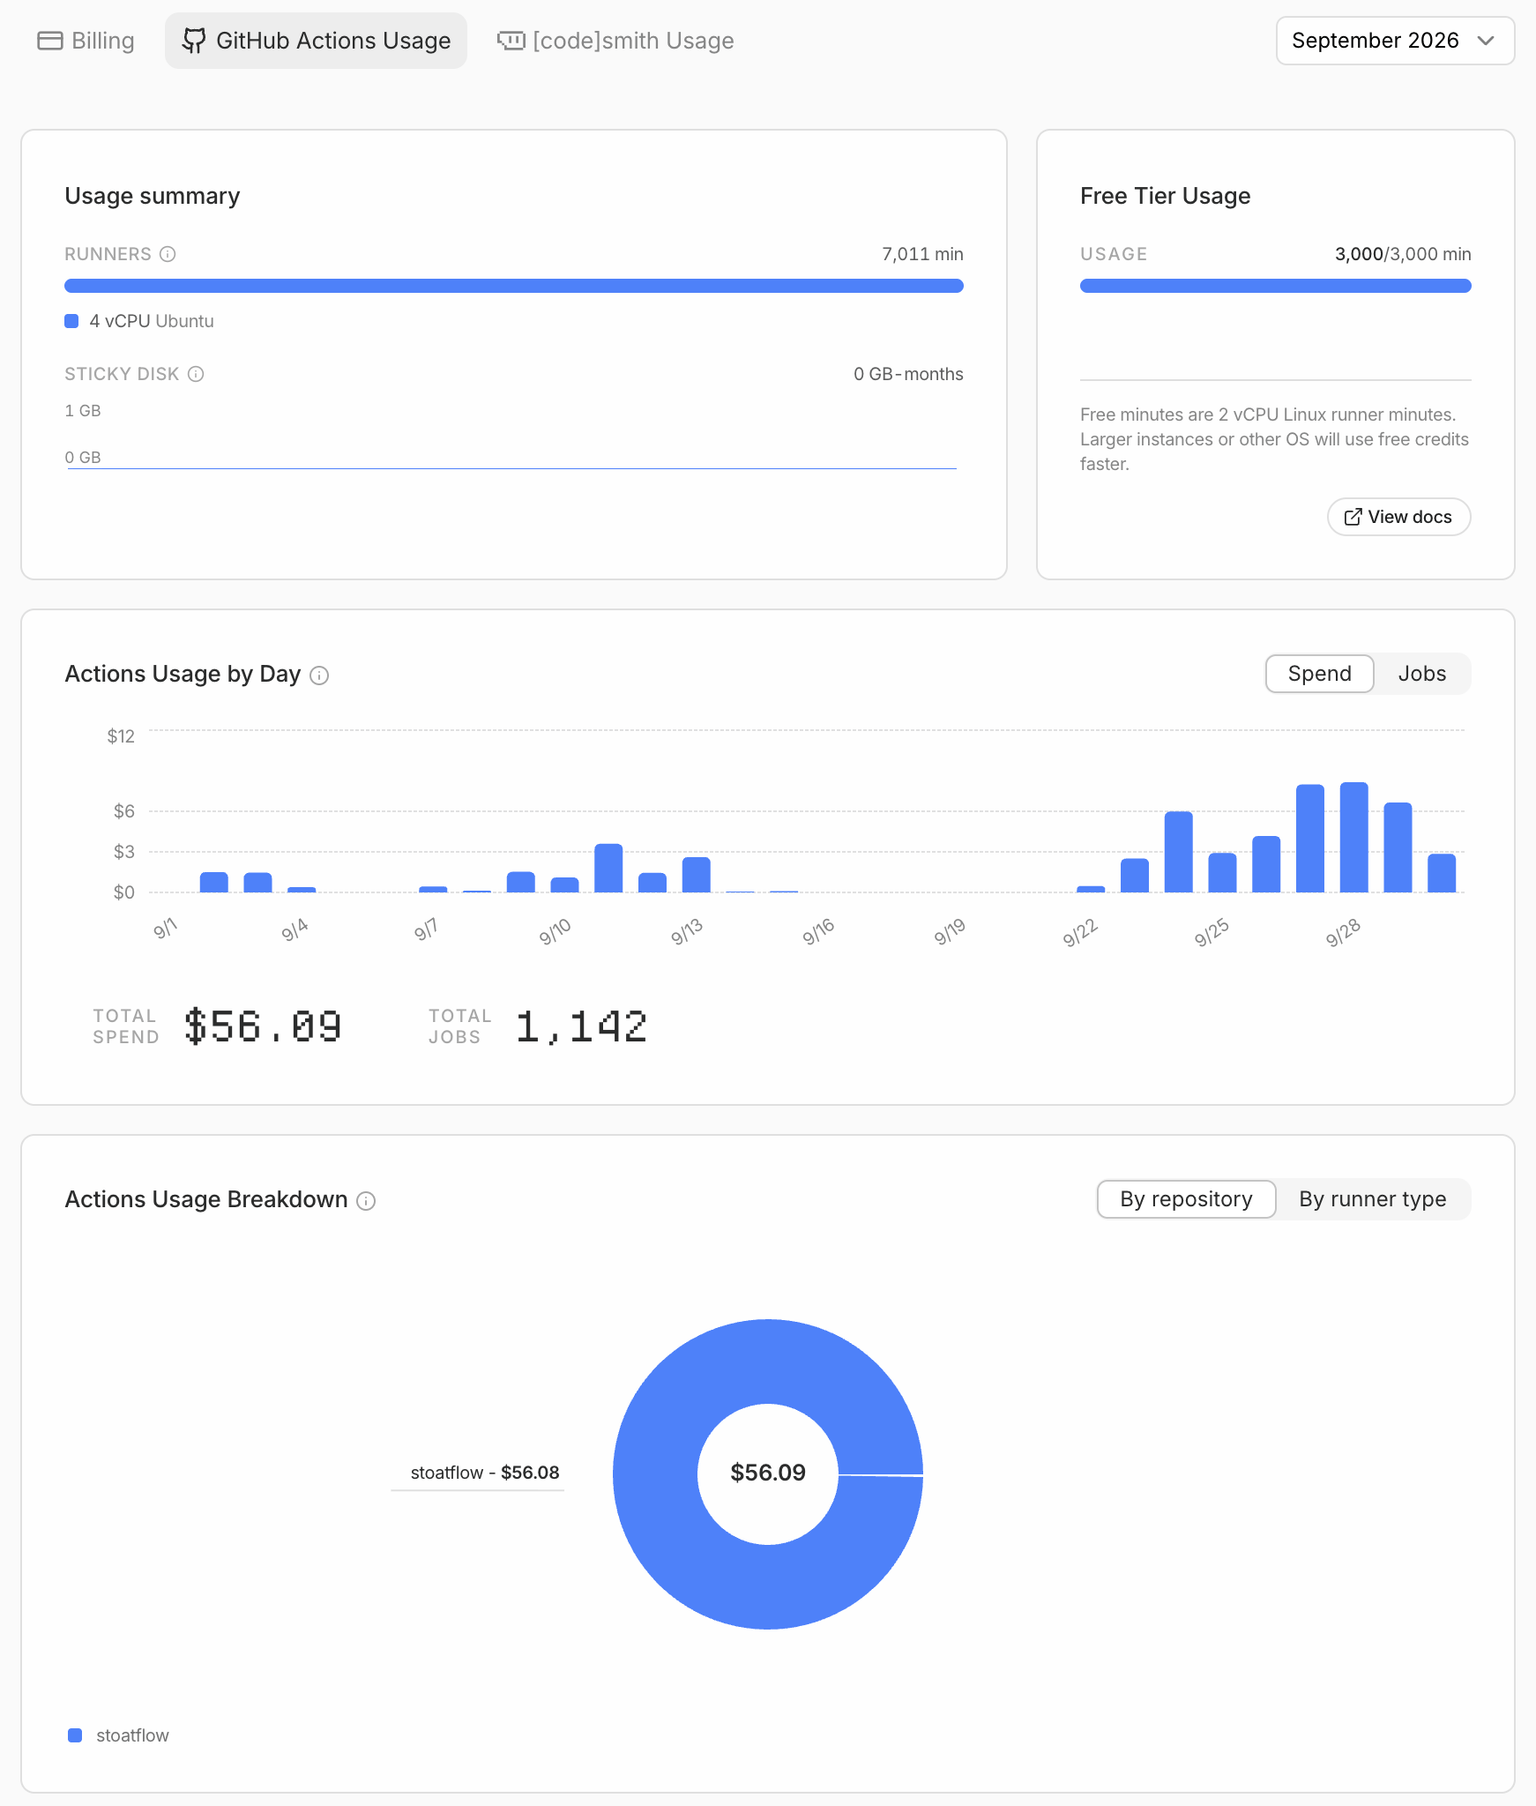
Cost moved less than the runner label suggests. Blacksmith bills per vCPU-minute, so integration-test on 8 vCPU for 10m43s uses ~86 vCPU-minutes where 4 vCPU for 37m15s used ~149: about 40% less, on the bigger runner. The longest job was the most expensive one, so shortening it is the main cost lever too.
Parallelism finds timing assumptions. The first twelve-fork run failed one test that had never failed before: it produced two records and closed the application immediately, assuming they had already been read. Under load, close() sometimes won, the engine correctly committed the earlier offset, and the assertion failed. The fix was in the test, which now waits for the records to be aggregated, as its sibling test already did.
The lesson is the one this post already ends on, applied one level down. Before buying hardware we measured the job graph. Before sizing hardware we should have measured what the runner actually did, and the provider's utilisation graphs had that answer all along.
Scheduled sources: a topology source that isn't a topic
Every source in a Kafka Streams topology is a topic. The calendar and your own state — a snapshot across keys, a sweep over what you hold — needed a job outside the topology or a punctuator bent into a source. StoatFlow's scheduled sources run your code on a schedule and turn what it forwards into an ordinary KStream: keyed, processed in parallel on the lanes, committed with the stream. What that opens up, how it works, two verified examples, and the catch — the emitter's view is read-only, a run does not yield to live traffic on its own, and a read from outside the engine is not in the transaction.
From first alpha to release candidate: the road to StoatFlow 1.0.0
StoatFlow 1.0.0-rc.1 is cut and the feature set is frozen — what separates the candidate from GA is proof, not features. The twelve weeks from the first alpha: 26 releases, 1,086 commits, a compatibility matrix grown from 417 to 619 tracked entries, three full-codebase review rounds — and the framework integration that kept us honest.